Skip to content

Practice SBI PO 2026 Prelims Quant PYQ – 2 Aug 2026 Shift 1 (30 Questions with Solutions)

30 questions. Choose an option and see at once whether it was right, with the correct answer and a worked solution. No timer, and nothing to submit.

0 of 30 answered

0 correct0 wrong

Answers here are not saved.Sign in to track your progress

  1. Question 1

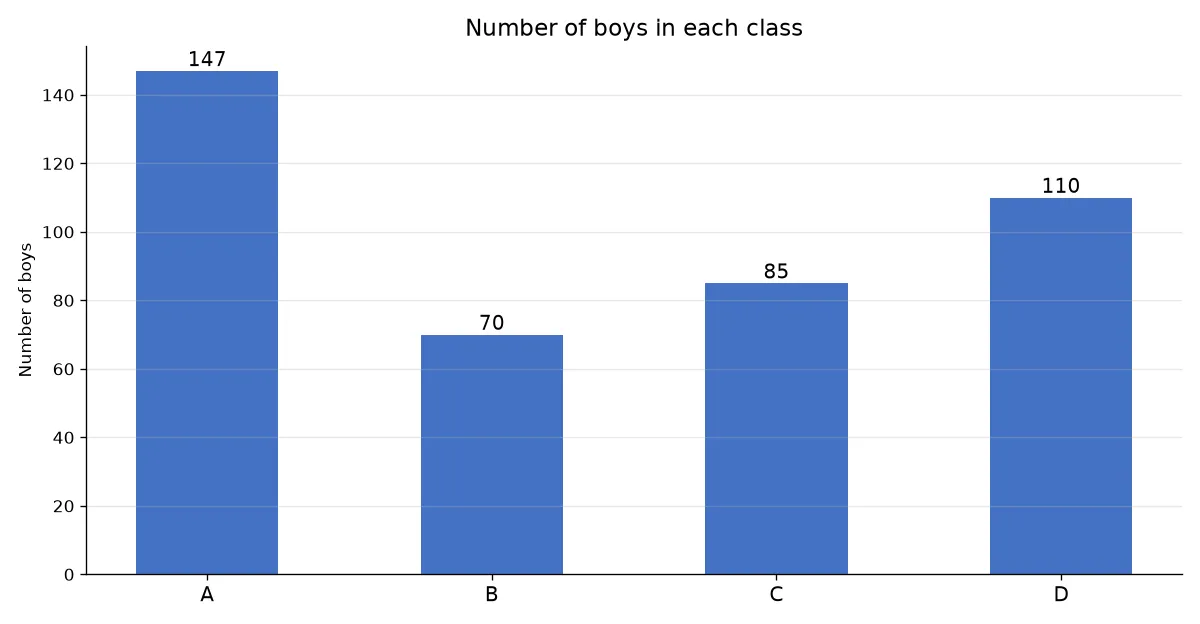
    Directions: The bar graph shows the number of boys, and the table shows the difference between the number of boys and girls, in four classes (A, B, C, D).
    chart

    ClassDifference between boys and girls
    A49
    B35
    C170
    D55

    Note: Only in C and D is the number of girls more than the number of boys.

    If 1/7th of the boys from class A and 1/5th of the girls from class C are transferred to class B, what will be the new total number of students in class B?
  2. Question 2

    Directions: The bar graph shows the number of boys, and the table shows the difference between the number of boys and girls, in four classes (A, B, C, D).

    chart

    ClassDifference between boys and girls
    A49
    B35
    C170
    D55

    Note: Only in C and D is the number of girls more than the number of boys.

    If the number of boys in class C increases by 40% and the number of girls in class C decreases by 20%, what will be the new ratio of boys to girls in class C?

  3. Question 3

    Directions: The bar graph shows the number of boys, and the table shows the difference between the number of boys and girls, in four classes (A, B, C, D).

    chart

    ClassDifference between boys and girls
    A49
    B35
    C170
    D55

    Note: Only in C and D is the number of girls more than the number of boys.

    The total number of girls in classes A and D together is approximately what percentage of the total number of students in all four classes?

  4. Question 4

    Directions: The bar graph shows the number of boys, and the table shows the difference between the number of boys and girls, in four classes (A, B, C, D).

    chart

    ClassDifference between boys and girls
    A49
    B35
    C170
    D55

    Note: Only in C and D is the number of girls more than the number of boys.

    What is the difference between the average number of boys per class and the average number of girls per class, considering all four classes?

  5. Question 5

    Directions: The bar graph shows the number of boys, and the table shows the difference between the number of boys and girls, in four classes (A, B, C, D).

    chart

    ClassDifference between boys and girls
    A49
    B35
    C170
    D55

    Note: Only in C and D is the number of girls more than the number of boys.

    Quantity I: Total students in classes A and B together, if the boys in A increase by 1/3rd and the girls in B increase by 2/7th.

    Quantity II: Total students in classes C and D together, if the girls in C decrease by 1/5th and the boys in D decrease by 1/10th.

  6. Question 6

    Directions: The bar graph shows the number of boys, and the table shows the difference between the number of boys and girls, in four classes (A, B, C, D).

    chart

    ClassDifference between boys and girls
    A49
    B35
    C170
    D55

    Note: Only in C and D is the number of girls more than the number of boys.

    In class D, if the number of boys had been 10% more and the number of girls 20% less than what they actually were, the new total would have been what percentage of the actual total number of students in class D?

  7. Question 7

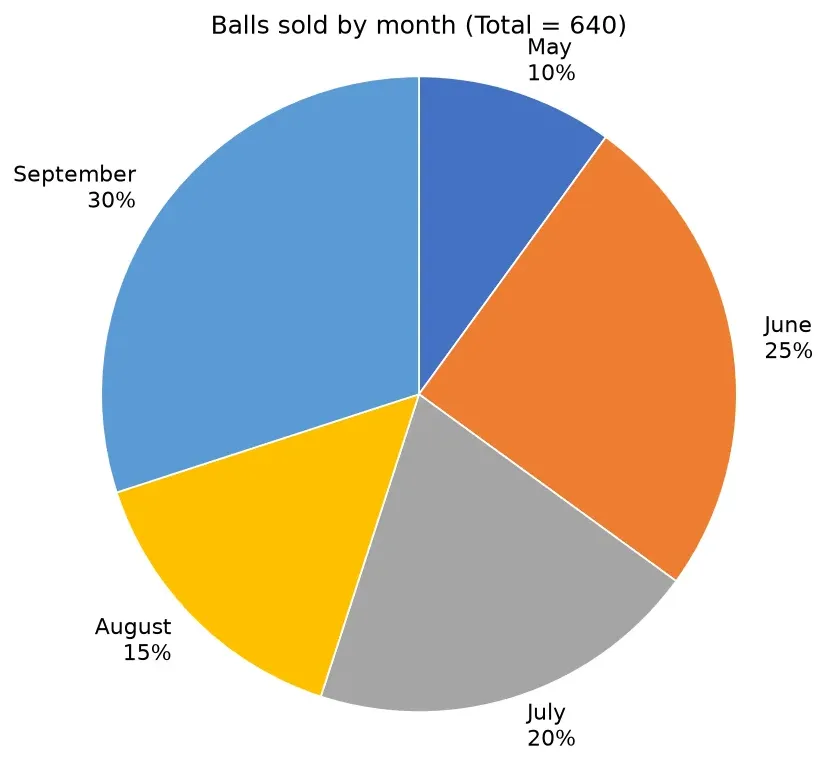
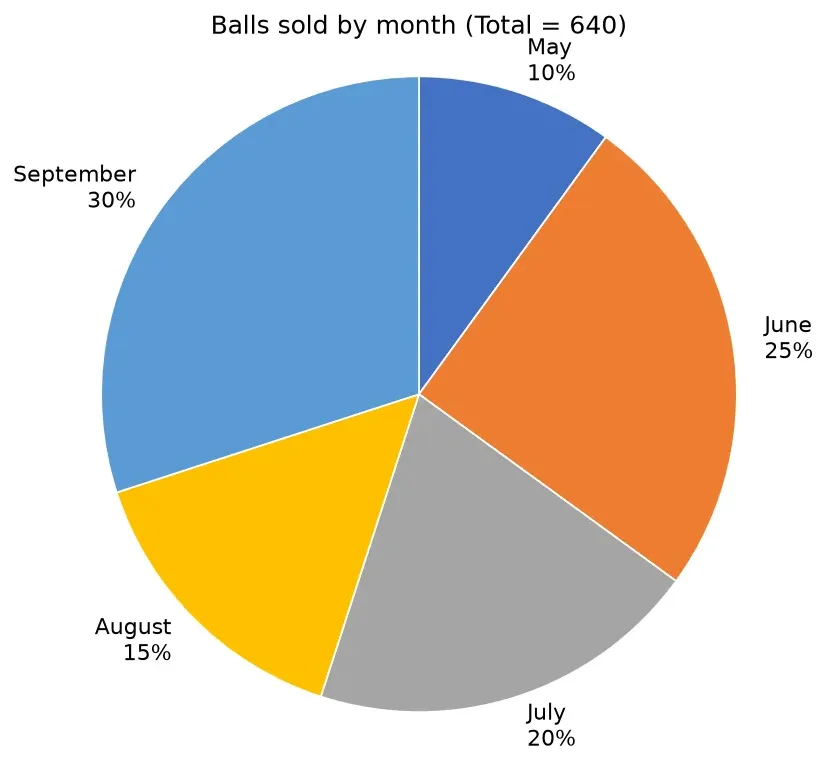
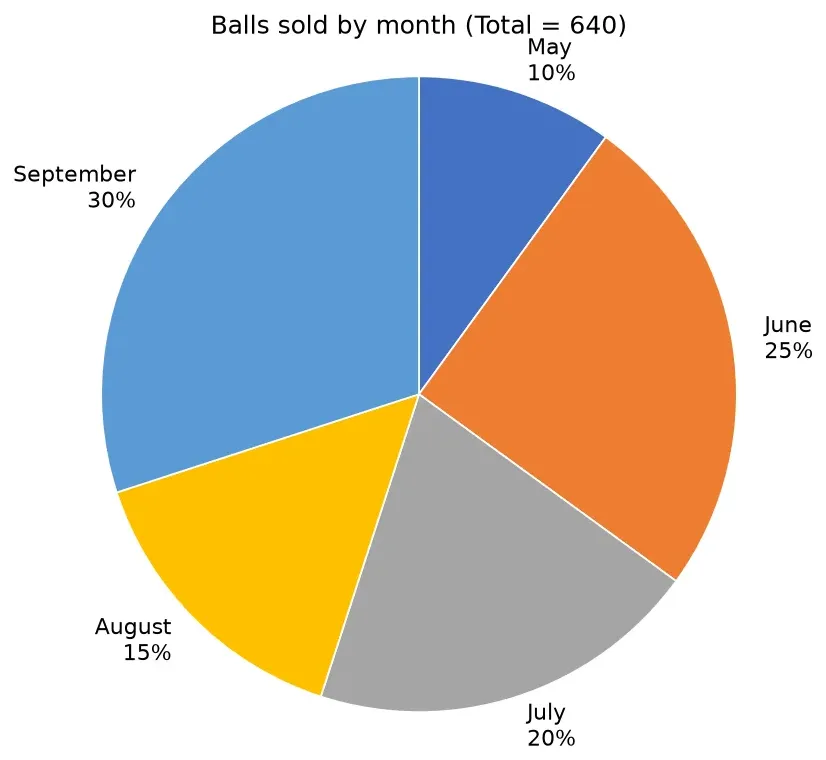
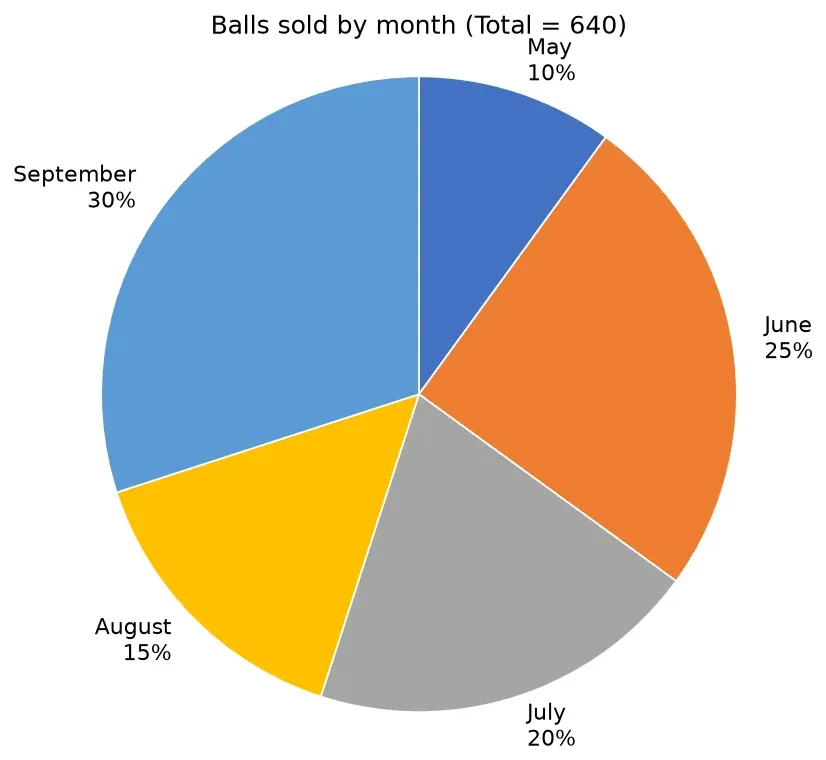
    Directions: The pie chart given below shows the percentage distribution of the total number of balls sold in May, June, July, August and September. Total balls sold = 640.

    chart

    If the number of balls sold in July increases by 25% and the number sold in August increases by 50%, what is the new combined total of balls sold in these two months?

  8. Question 8

    Directions: The pie chart given below shows the percentage distribution of the total number of balls sold in May, June, July, August and September. Total balls sold = 640.

    chart

    If the ratio of blue balls to red balls sold in June is \(5 : 3\) and the number of blue balls sold in May is 15, then find the difference between the red balls sold in June and in May. (Each ball sold is either blue or red.)

  9. Question 9

    Directions: The pie chart given below shows the percentage distribution of the total number of balls sold in May, June, July, August and September. Total balls sold = 640.

    chart

    What is the ratio of the total balls sold in May and June together to the total balls sold in August and September together?

  10. Question 10

    Directions: The pie chart given below shows the percentage distribution of the total number of balls sold in May, June, July, August and September. Total balls sold = 640.

    chart

    The total number of balls sold in June, July, and August together is what percentage of the total number of balls sold across all five months?

Recommended courses for Banking

All Banking courses
Chat with an academic counsellor on WhatsApp