
Question 1
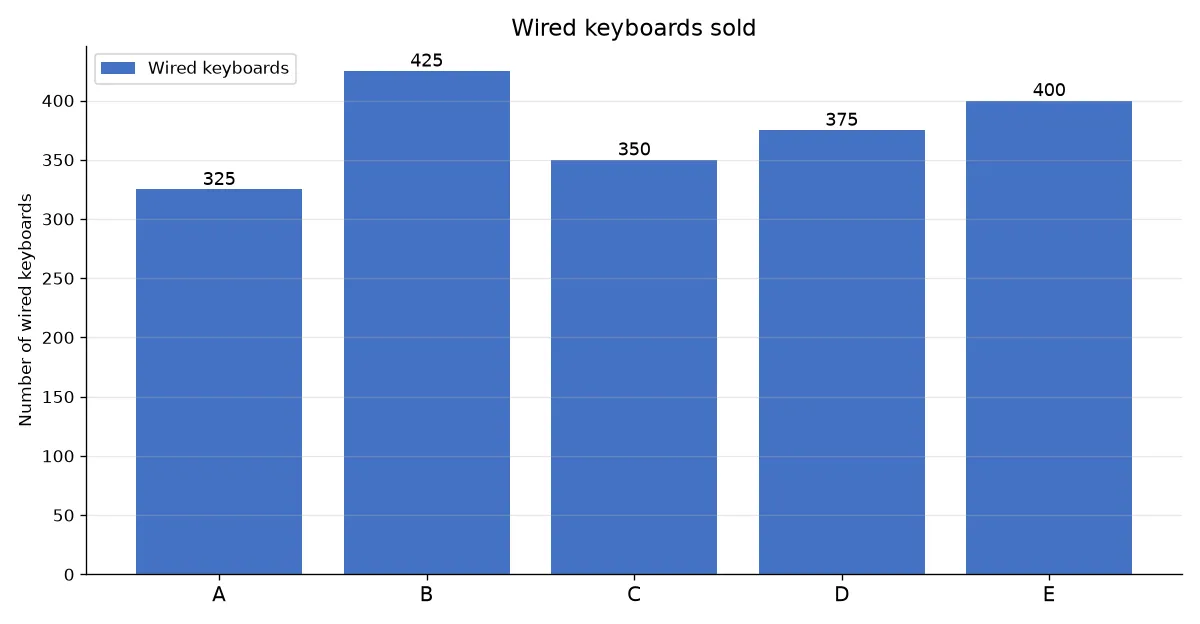
Directions: The bar graph shows the number of wired keyboards sold by five shops, and the table shows the percentage of wireless keyboards sold out of the total keyboards (wired + wireless) sold by each shop.
| Shop | Wireless keyboards out of total keyboards sold |
|---|---|
| A | 35% |
| B | 32% |
| C | 50% |
| D | 70% |
| E | 80% |
Find the ratio of the wired keyboards sold by A and B together to the wireless keyboards sold by D.