
Skip to content

Practice SBI PO 2025 Prelims Quant PYQ – 4 Aug 2025 Shift 1 (30 Questions with Solutions)

30 questions. Choose an option and see at once whether it was right, with the correct answer and a worked solution. No timer, and nothing to submit.

0 of 30 answered

0 correct0 wrong

Answers here are not saved.Sign in to track your progress

  1. Question 1

    The pie chart given below shows the total population in five cities (A, B, C, D, E).
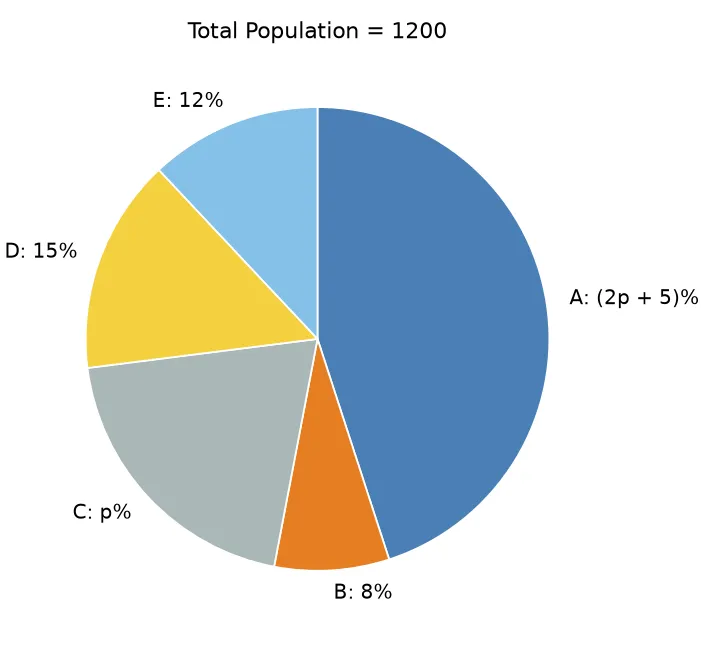
    chart

    In city F, the population of males is 50% more than the total population in D and female population is 20% less than the average population of B and E. Find the total population of F (male + females) is what percentage of total population of C?

  2. Question 2

    The pie chart given below shows the total population in five cities (A, B, C, D, E).

    chart

    Find the difference between sum of total population of B and C and total population of E?

  3. Question 3

    The pie chart given below shows the total population in five cities (A, B, C, D, E).

    chart

    In C, the ratio of male and females is \(2 : 5\) and female to children is \(1 : 1.\) Find the ratio of children in C to total population of E.

  4. Question 4

    The pie chart given below shows the total population in five cities (A, B, C, D, E).

    chart

    The population of cities D and E is what percentage more/less than the total population of A and C

  5. Question 5

    The pie chart given below shows the total population in five cities (A, B, C, D, E).

    chart

    Out of the total population of all the cities 35% are females and 55% of the total population of city D are females. Total females in all the cities except D is how many more/ less than total population of A.

  6. Question 6

    Read the information and answer the following questions.

    The information is about 100 people and three beverages — tea, coffee and milk. The ratio of people who like only tea and only coffee is \(5 : 3.\) The number of people who like only milk is equal to the number of people who like only tea and coffee together. 16 people like all three beverages. The people who like only milk and tea together are 30% more than the people who like only coffee and milk together. The people who like only coffee and milk together are 20, which is double the number of people who like only tea.

    Find the number of people who like only one beverage.

  7. Question 7

    Read the information and answer the following questions.

    The information is about 100 people and three beverages — tea, coffee and milk. The ratio of people who like only tea and only coffee is \(5 : 3.\) The number of people who like only milk is equal to the number of people who like only tea and coffee together. 16 people like all three beverages. The people who like only milk and tea together are 30% more than the people who like only coffee and milk together. The people who like only coffee and milk together are 20, which is double the number of people who like only tea.

    The number of people who like coffee is what percentage of the people who like all three beverages?

  8. Question 8

    Read the information and answer the following questions.

    The information is about 100 people and three beverages — tea, coffee and milk. The ratio of people who like only tea and only coffee is \(5 : 3.\) The number of people who like only milk is equal to the number of people who like only tea and coffee together. 16 people like all three beverages. The people who like only milk and tea together are 30% more than the people who like only coffee and milk together. The people who like only coffee and milk together are 20, which is double the number of people who like only tea.

    Find the ratio of people who like only two beverages together to who like only coffee.

  9. Question 9

    Read the information and answer the following questions.

    The information is about 100 people and three beverages — tea, coffee and milk. The ratio of people who like only tea and only coffee is \(5 : 3.\) The number of people who like only milk is equal to the number of people who like only tea and coffee together. 16 people like all three beverages. The people who like only milk and tea together are 30% more than the people who like only coffee and milk together. The people who like only coffee and milk together are 20, which is double the number of people who like only tea.

    Find the difference between people who like milk and tea.

  10. Question 10

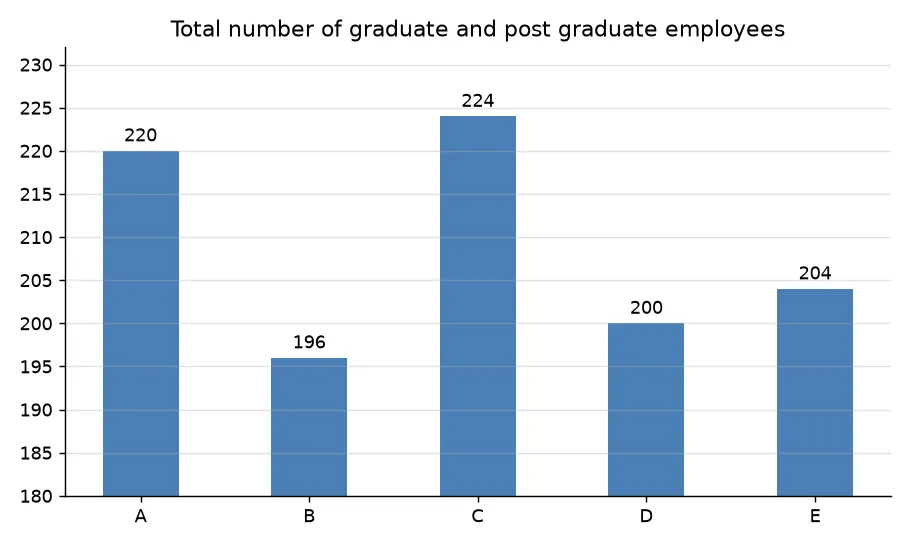
    The bar graph given below shows the total number of graduate and post graduate employees in five different companies. The table shows the difference between graduate and post graduate employees.

    chart

    CompaniesGraduate − Post Graduate employees
    A4
    B2
    C36
    D90
    E96

    Note: Total Employees = Graduate + Post Graduate Employees. Graduate employees are more than Post Graduate employees.

    Find the difference between average number of graduate employees in B and D and average number of post graduate employees in A and E?

Recommended courses for Banking

All Banking courses
Chat with an academic counsellor on WhatsApp