
Skip to content

Practice SBI PO 2024 Prelims Quant PYQ – 8 Mar 2025 Shift 4 (30 Questions with Solutions)

30 questions. Choose an option and see at once whether it was right, with the correct answer and a worked solution. No timer, and nothing to submit.

0 of 30 answered

0 correct0 wrong

Answers here are not saved.Sign in to track your progress

  1. Question 1

    The table shows the total books (fiction + non-fiction) sold by five shopkeepers. Read the table and answer the following questions given below.

    ShopkeeperTotal booksNon-fiction books
    A210\(\dfrac{8}{13}\) of total fiction books
    B760378 less than total fiction books
    C360120
    D495\(\dfrac{5}{9}\) of total books
    E56014.28% of total books

    20% of the non-fiction books sold by C at the rate of Rs.25 and rest sold at Rs 20. Find the revenue (in Rs) generated by C after selling all the non-fiction books.

  2. Question 2

    The table shows the total books (fiction + non-fiction) sold by five shopkeepers. Read the table and answer the following questions given below.

    ShopkeeperTotal booksNon-fiction books
    A210\(\dfrac{8}{13}\) of total fiction books
    B760378 less than total fiction books
    C360120
    D495\(\dfrac{5}{9}\) of total books
    E56014.28% of total books

    Find the ratio of non- fiction books sold by C and fiction book sold by A together to total books sold by C and E together.

  3. Question 3

    The table shows the total books (fiction + non-fiction) sold by five shopkeepers. Read the table and answer the following questions given below.

    ShopkeeperTotal booksNon-fiction books
    A210\(\dfrac{8}{13}\) of total fiction books
    B760378 less than total fiction books
    C360120
    D495\(\dfrac{5}{9}\) of total books
    E56014.28% of total books

    Find the average number of fiction books sold by A and E is what percentage of fiction books sold by D and A (Approx).

  4. Question 4

    The table shows the total books (fiction + non-fiction) sold by five shopkeepers. Read the table and answer the following questions given below.

    ShopkeeperTotal booksNon-fiction books
    A210\(\dfrac{8}{13}\) of total fiction books
    B760378 less than total fiction books
    C360120
    D495\(\dfrac{5}{9}\) of total books
    E56014.28% of total books

    14.28% of total books sold by E are defective and out of that 20% are non-fiction books. Find the defective fiction books sold by E is how many more/less than total books sold by C.

  5. Question 5

    The table shows the total books (fiction + non-fiction) sold by five shopkeepers. Read the table and answer the following questions given below.

    ShopkeeperTotal booksNon-fiction books
    A210\(\dfrac{8}{13}\) of total fiction books
    B760378 less than total fiction books
    C360120
    D495\(\dfrac{5}{9}\) of total books
    E56014.28% of total books

    If the ratio of total books sold by Z to total fictional book sold by A is \(23 : 13.\) 30% of books sold by Z are fictional. Find the non-fiction book sold by Z.

  6. Question 6

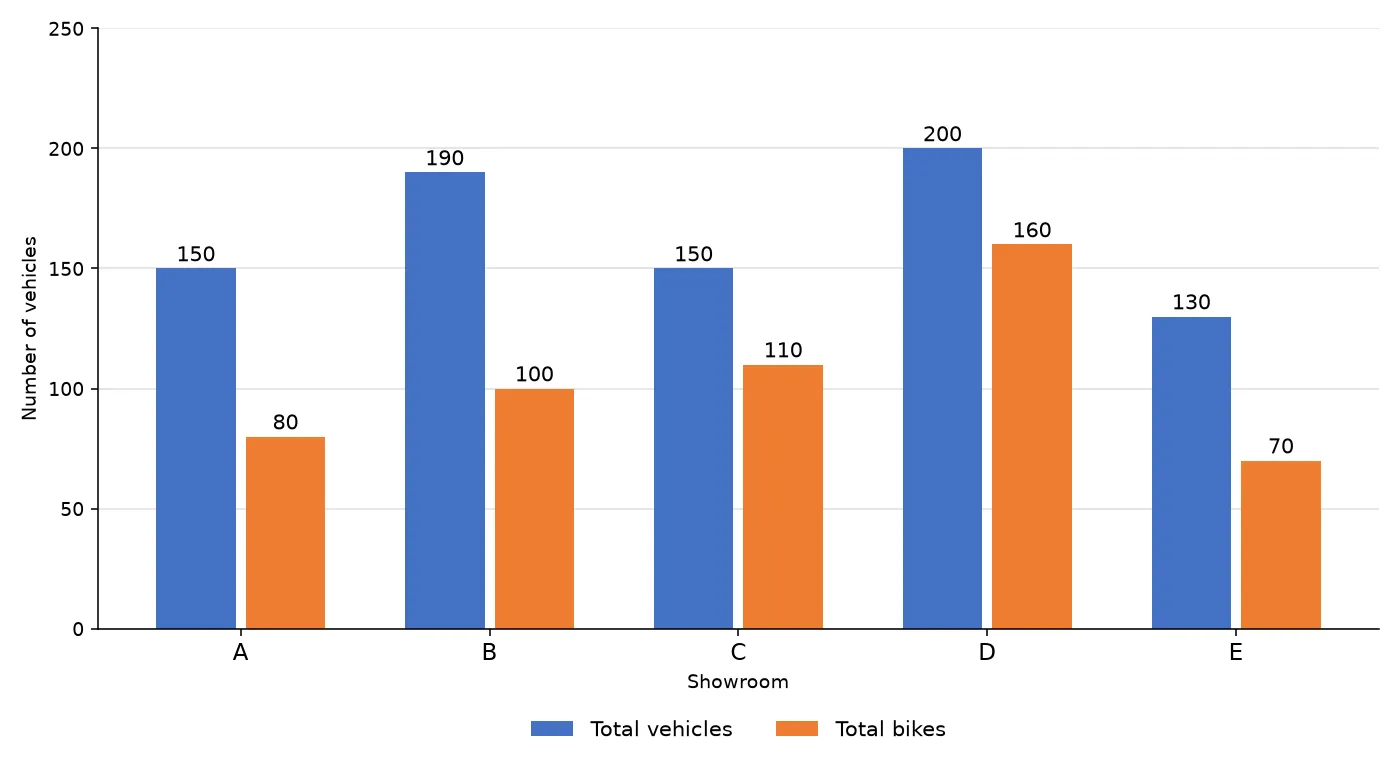
    The graph given below shows the total number of vehicles (cars + bikes) and the total number of bikes in five different showrooms. Read the graph and answer the following questions.

    chart

    In shop F, total number of bikes are 25% more than the cars in E and total number of vehicles are average number of vehicles in A and B. Find the cars in F is what percentage more/less than bikes in B.

  7. Question 7

    The graph given below shows the total number of vehicles (cars + bikes) and the total number of bikes in five different showrooms. Read the graph and answer the following questions.

    chart

    Find the difference between average number of cars in A and B and average number of bikes in C and E.

  8. Question 8

    The graph given below shows the total number of vehicles (cars + bikes) and the total number of bikes in five different showrooms. Read the graph and answer the following questions.

    chart

    The ratio of sold to unsold bikes in D is \(3 : 1\) and number of unsold bikes in D is 20% less than cars sold by B. Find the unsold cars in B.

  9. Question 9

    The graph given below shows the total number of vehicles (cars + bikes) and the total number of bikes in five different showrooms. Read the graph and answer the following questions.

    chart

    The cars booked online in A is 60 and rest booked offline. 20% of bikes books online in A. find the difference between vehicles booked online and offline.

  10. Question 10

    The graph given below shows the total number of vehicles (cars + bikes) and the total number of bikes in five different showrooms. Read the graph and answer the following questions.

    chart

    If defective cars in D is \(\dfrac{1}{8}\) of total bikes in A and non – defective bike in D is \(\dfrac{1}{2}\) of the non- defective cars in D. find the total defective vehicles in D.

Recommended courses for Banking

All Banking courses
Chat with an academic counsellor on WhatsApp