Skip to content

Practice SBI PO 2024 Prelims Quant PYQ – 8 Mar 2025 Shift 2 (30 Questions with Solutions)

30 questions. Choose an option and see at once whether it was right, with the correct answer and a worked solution. No timer, and nothing to submit.

0 of 30 answered

0 correct0 wrong

Answers here are not saved.Sign in to track your progress

  1. Question 1

    Directions: The table shows the total number of volleyballs, bats and footballs sold on five days, the ratio of bats to footballs sold, and the difference between the bats and footballs sold.

    DayTotal soldBats : FootballsDifference (bats, footballs)
    Monday140\(5 : 1\)60
    Tuesday129\(2 : 1\)38
    Wednesday100\(1 : 3\)40
    Thursday140\(3 : 2\)20
    Friday130\(1 : 1\)0

    Note: the volleyballs sold on Monday equal the footballs sold on Friday.

    There are two types of volleyball sold A and B on Thursday. Type A volleyball sold is 66.66% that of type B. Find the type B volleyball sold.
  2. Question 2

    Directions: The table shows the total number of volleyballs, bats and footballs sold on five days, the ratio of bats to footballs sold, and the difference between the bats and footballs sold.

    DayTotal soldBats : FootballsDifference (bats, footballs)
    Monday140\(5 : 1\)60
    Tuesday129\(2 : 1\)38
    Wednesday100\(1 : 3\)40
    Thursday140\(3 : 2\)20
    Friday130\(1 : 1\)0

    Note: the volleyballs sold on Monday equal the footballs sold on Friday.

    On Wednesday, 20% of the equipment sold are defective out of which 9 equipment are bat and the ratio of defective volleyball to football sold is \(5 : 6.\) Find the defective bat and football sold.

  3. Question 3

    Directions: The table shows the total number of volleyballs, bats and footballs sold on five days, the ratio of bats to footballs sold, and the difference between the bats and footballs sold.

    DayTotal soldBats : FootballsDifference (bats, footballs)
    Monday140\(5 : 1\)60
    Tuesday129\(2 : 1\)38
    Wednesday100\(1 : 3\)40
    Thursday140\(3 : 2\)20
    Friday130\(1 : 1\)0

    Note: the volleyballs sold on Monday equal the footballs sold on Friday.

    On Saturday, the number of bat sold are 20% more than that of Monday and average number of football and volleyball sold is 50. Find the total equipment sold on Saturday.

  4. Question 4

    Directions: The table shows the total number of volleyballs, bats and footballs sold on five days, the ratio of bats to footballs sold, and the difference between the bats and footballs sold.

    DayTotal soldBats : FootballsDifference (bats, footballs)
    Monday140\(5 : 1\)60
    Tuesday129\(2 : 1\)38
    Wednesday100\(1 : 3\)40
    Thursday140\(3 : 2\)20
    Friday130\(1 : 1\)0

    Note: the volleyballs sold on Monday equal the footballs sold on Friday.

    Bats sold on Wednesday and Tuesday together is what percentage more or less than football sold on Friday.

  5. Question 5

    Directions: The table shows the total number of volleyballs, bats and footballs sold on five days, the ratio of bats to footballs sold, and the difference between the bats and footballs sold.

    DayTotal soldBats : FootballsDifference (bats, footballs)
    Monday140\(5 : 1\)60
    Tuesday129\(2 : 1\)38
    Wednesday100\(1 : 3\)40
    Thursday140\(3 : 2\)20
    Friday130\(1 : 1\)0

    Note: the volleyballs sold on Monday equal the footballs sold on Friday.

    Find the average number of bats sold on Monday, Tuesday and Wednesday.

  6. Question 6

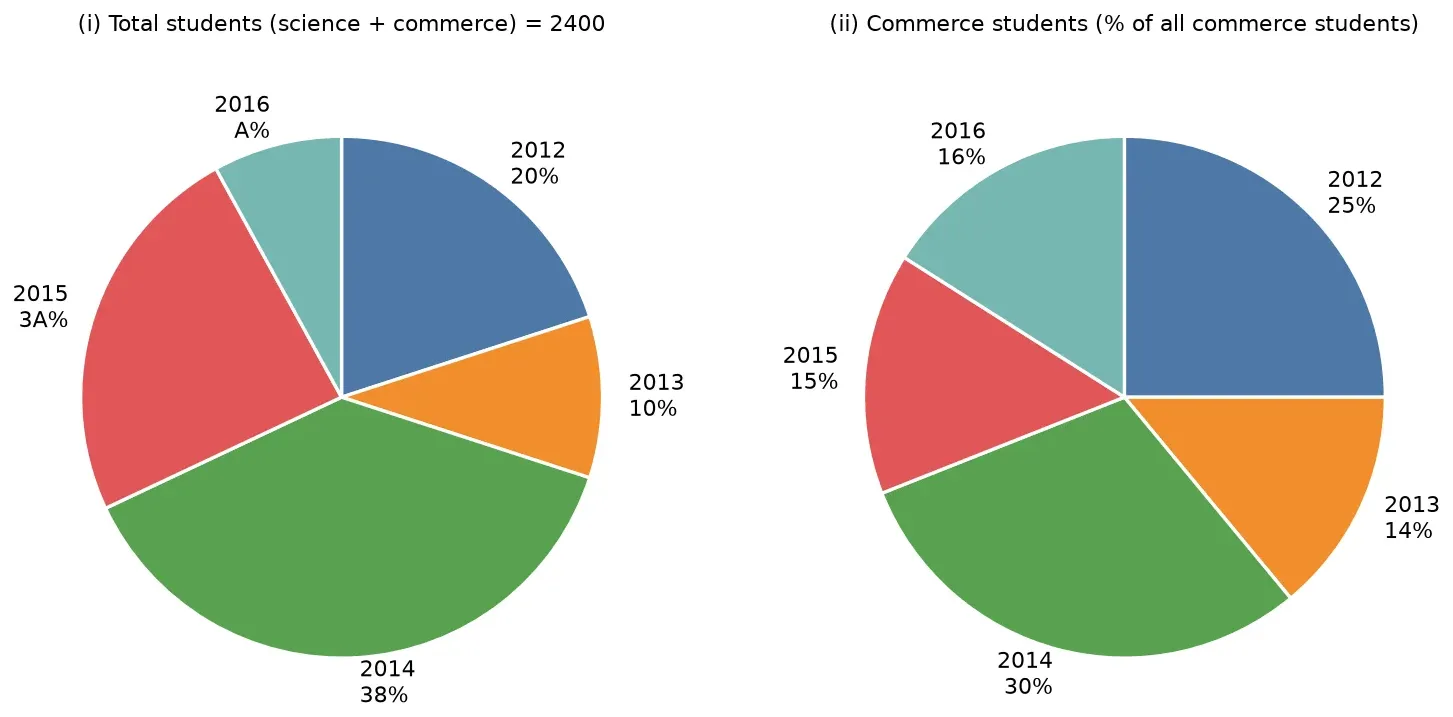
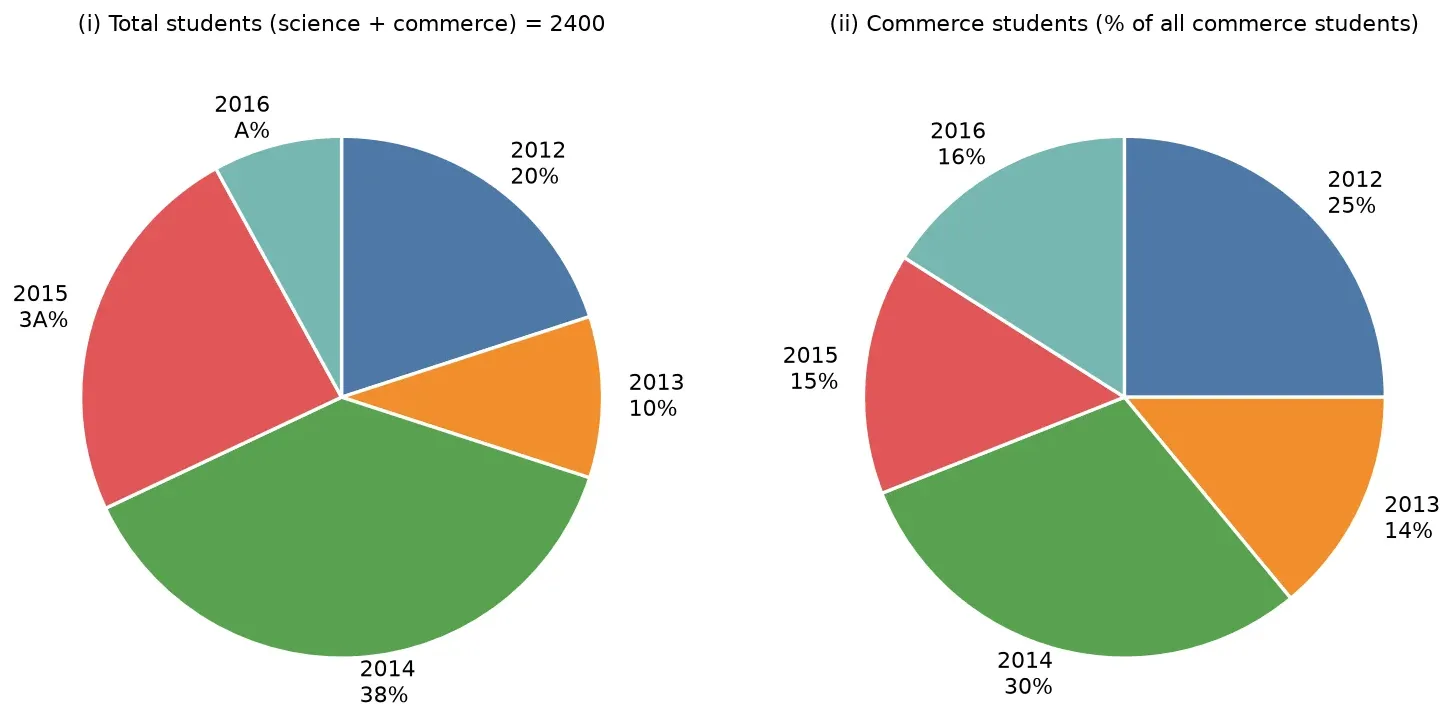
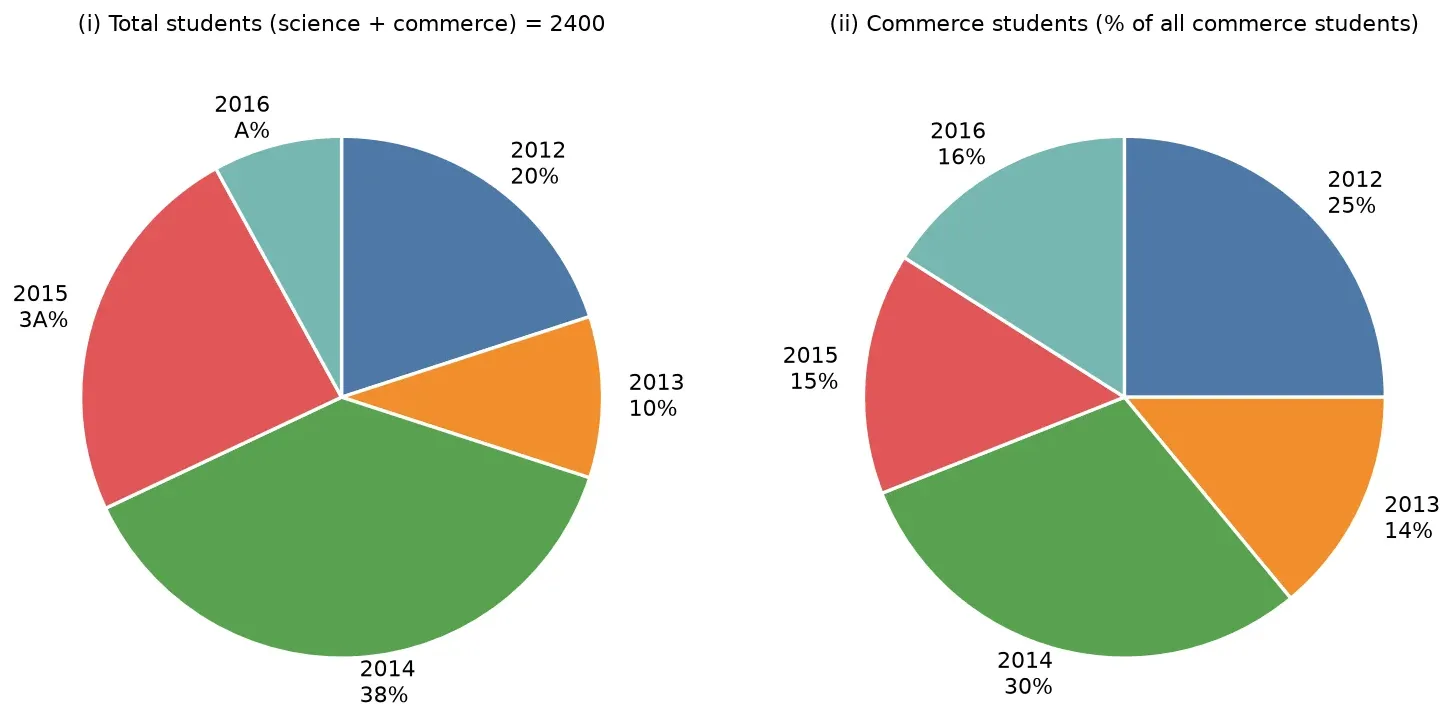
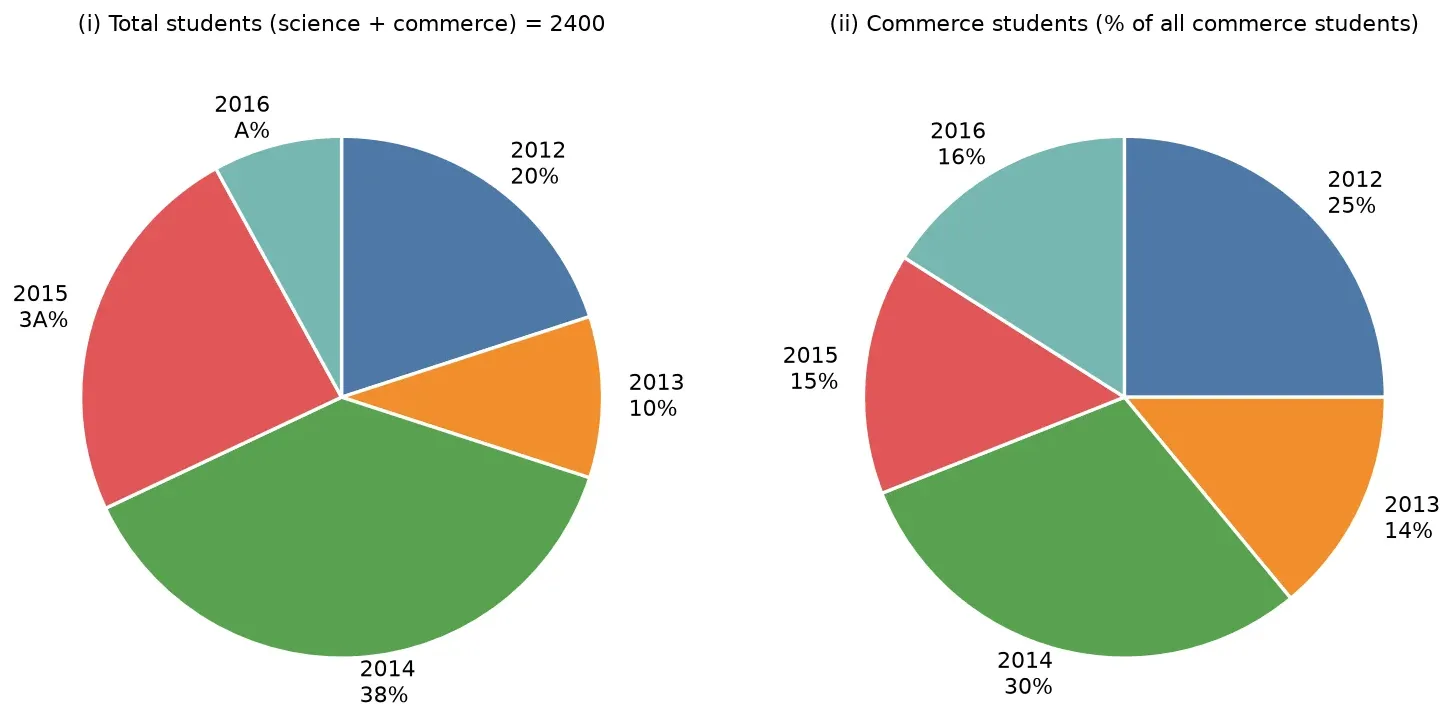
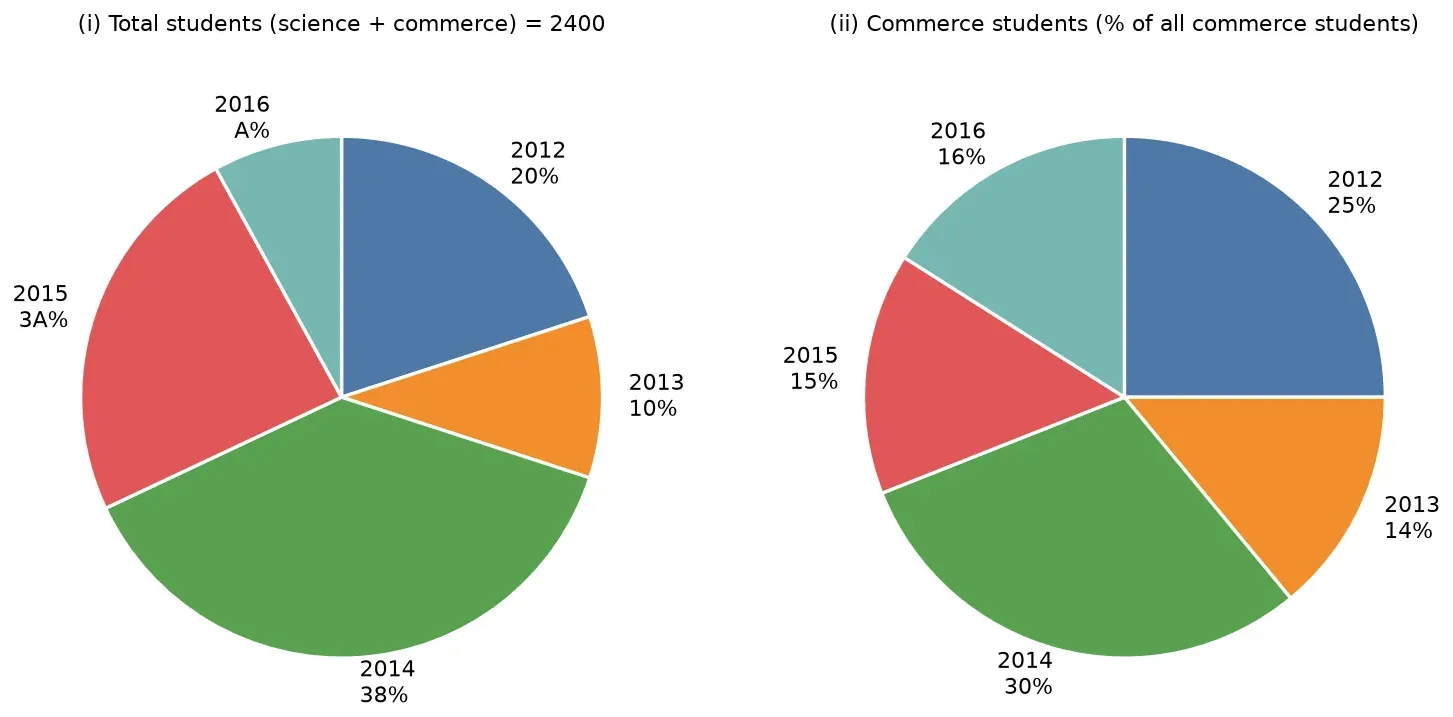
    Directions: Pie chart (i) shows the distribution of the total number of students (science and commerce) over five years, 2012 to 2016. Pie chart (ii) shows the distribution of the commerce students over the same years.

    chart

    Note: (i) Total students = commerce + science. (ii) Commerce students in 2013 are 8 fewer than in 2015.

    The difference between commerce students in 2016 and science student in 2012 is what percentage of total student in 2013.

  7. Question 7

    Directions: Pie chart (i) shows the distribution of the total number of students (science and commerce) over five years, 2012 to 2016. Pie chart (ii) shows the distribution of the commerce students over the same years.

    chart

    Note: (i) Total students = commerce + science. (ii) Commerce students in 2013 are 8 fewer than in 2015.

    Find the ratio of commerce student in 2016 and 2015 to total students 2015.

  8. Question 8

    Directions: Pie chart (i) shows the distribution of the total number of students (science and commerce) over five years, 2012 to 2016. Pie chart (ii) shows the distribution of the commerce students over the same years.

    chart

    Note: (i) Total students = commerce + science. (ii) Commerce students in 2013 are 8 fewer than in 2015.

    Find the difference between average number of students in 2012 & 2016 and total science student in 2015.

  9. Question 9

    Directions: Pie chart (i) shows the distribution of the total number of students (science and commerce) over five years, 2012 to 2016. Pie chart (ii) shows the distribution of the commerce students over the same years.

    chart

    Note: (i) Total students = commerce + science. (ii) Commerce students in 2013 are 8 fewer than in 2015.

    Total 25% of the student are from Art in 2013 and rest are from Science and Commerce. Find the total number of students in Arts, Science and Commerce.

  10. Question 10

    Directions: Pie chart (i) shows the distribution of the total number of students (science and commerce) over five years, 2012 to 2016. Pie chart (ii) shows the distribution of the commerce students over the same years.

    chart

    Note: (i) Total students = commerce + science. (ii) Commerce students in 2013 are 8 fewer than in 2015.

    In 2017, the total students are 20% of total students in 2012 and students in commerce is 25% less than that in 2015. Find the science students in 2017.

Recommended courses for Banking

All Banking courses
Chat with an academic counsellor on WhatsApp