
Skip to content

Practice SBI PO 2024 Prelims Quant PYQ – 8 Mar 2025 Shift 1 (30 Questions with Solutions)

30 questions. Choose an option and see at once whether it was right, with the correct answer and a worked solution. No timer, and nothing to submit.

0 of 30 answered

0 correct0 wrong

Answers here are not saved.Sign in to track your progress

  1. Question 1

    The table shows the flats occupied by public sector employees in four different buildings, the ratio of flats occupied by public sector and private sector employees and the percentage of vacant flats. Read the table and answer the following questions.

    BuildingFlats occupied by public sector employeesRatio of flats occupied (public : private)Vacant flats (% of total flats)
    A\(4x + 40\)\(2 : 1\)40%
    B240\(8 : 5\)25%
    C300\(5 : 3\)20%
    D150\(2 : 1\)55%

    Note: 1. Occupied flats in A is 300.
    2. Total flats in the building = occupied flats + vacant flats.

    In A, the number of flats occupied by females working in the public sector is 120, which is 20% more than the number of flats occupied by males working in the private sector. Find the sum of flats occupied by males in the public sector and females in the private sector.
  2. Question 2

    The table shows the flats occupied by public sector employees in four different buildings, the ratio of flats occupied by public sector and private sector employees and the percentage of vacant flats. Read the table and answer the following questions.

    BuildingFlats occupied by public sector employeesRatio of flats occupied (public : private)Vacant flats (% of total flats)
    A\(4x + 40\)\(2 : 1\)40%
    B240\(8 : 5\)25%
    C300\(5 : 3\)20%
    D150\(2 : 1\)55%

    Note: 1. Occupied flats in A is 300.
    2. Total flats in the building = occupied flats + vacant flats.

    In building F, the ratio occupied to vacant flat is same as building B and flats occupied by public sector employees is the average of flats occupied by private sector employees in A and B. If the vacant flats in F is 2/5th of flats occupied by public sector employees. Find the total flats occupied by private sector employees in F.

  3. Question 3

    The table shows the flats occupied by public sector employees in four different buildings, the ratio of flats occupied by public sector and private sector employees and the percentage of vacant flats. Read the table and answer the following questions.

    BuildingFlats occupied by public sector employeesRatio of flats occupied (public : private)Vacant flats (% of total flats)
    A\(4x + 40\)\(2 : 1\)40%
    B240\(8 : 5\)25%
    C300\(5 : 3\)20%
    D150\(2 : 1\)55%

    Note: 1. Occupied flats in A is 300.
    2. Total flats in the building = occupied flats + vacant flats.

    Find the ratio of vacant flats in C and occupied flats in B together to flats occupied by private employees in C and flats occupied by public sector employees in D.

  4. Question 4

    The table shows the flats occupied by public sector employees in four different buildings, the ratio of flats occupied by public sector and private sector employees and the percentage of vacant flats. Read the table and answer the following questions.

    BuildingFlats occupied by public sector employeesRatio of flats occupied (public : private)Vacant flats (% of total flats)
    A\(4x + 40\)\(2 : 1\)40%
    B240\(8 : 5\)25%
    C300\(5 : 3\)20%
    D150\(2 : 1\)55%

    Note: 1. Occupied flats in A is 300.
    2. Total flats in the building = occupied flats + vacant flats.

    In D, 20% of the public sector employees have car and remaining have bike and 40% of the private sector employees have bikes and remaining have cars. Find the difference between public sector employees have bike and private sector employees have car.

  5. Question 5

    The table shows the flats occupied by public sector employees in four different buildings, the ratio of flats occupied by public sector and private sector employees and the percentage of vacant flats. Read the table and answer the following questions.

    BuildingFlats occupied by public sector employeesRatio of flats occupied (public : private)Vacant flats (% of total flats)
    A\(4x + 40\)\(2 : 1\)40%
    B240\(8 : 5\)25%
    C300\(5 : 3\)20%
    D150\(2 : 1\)55%

    Note: 1. Occupied flats in A is 300.
    2. Total flats in the building = occupied flats + vacant flats.

    If the number of flats in a floor is 2.5x and number of flats in each floor is same. Find the sum of number of floor in C and D.

  6. Question 6

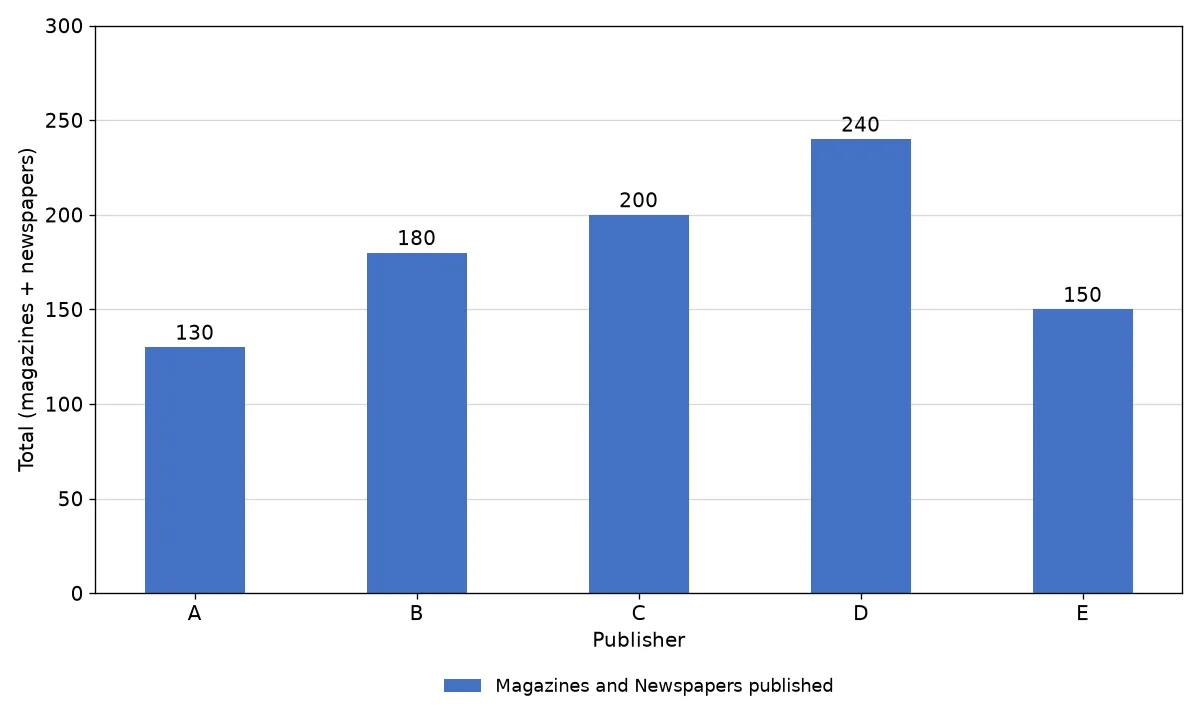
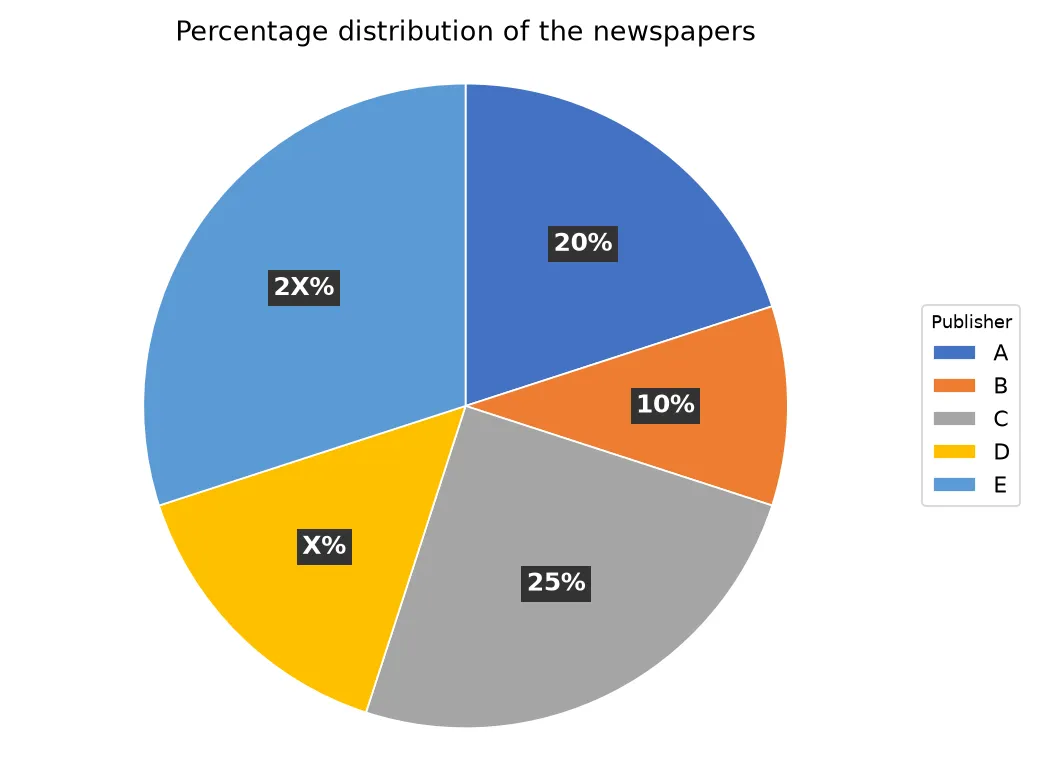
    Read the following pie chart and bar graph carefully and answer the questions given below. The bar graph shows total number of magazines and newspapers published by five different publishers. The pie chart shows the percentage distribution of the newspapers published by these publishers.

    Note: The total number of magazines published by A is 50.

    chart

    chart

    The total number of newspapers published by F is 25% more than that of by C and the total number of magazines published by B and F in the ratio of \(7 : 4\) respectively. Find the difference between the total number of magazines and newspapers published by F.

  7. Question 7

    Read the following pie chart and bar graph carefully and answer the questions given below. The bar graph shows total number of magazines and newspapers published by five different publishers. The pie chart shows the percentage distribution of the newspapers published by these publishers.

    Note: The total number of magazines published by A is 50.

    chart

    chart

    40% of the number of magazines published by A are sold and 20% of the number of newspapers published by A are unsold, then find the ratio of the total number of magazines and newspapers sold by A.

  8. Question 8

    Read the following pie chart and bar graph carefully and answer the questions given below. The bar graph shows total number of magazines and newspapers published by five different publishers. The pie chart shows the percentage distribution of the newspapers published by these publishers.

    Note: The total number of magazines published by A is 50.

    chart

    chart

    The ratio of sports to fashion magazines published by D is in the ratio of \(5 : 4\) respectively. The number of sports magazines published by D is what percentage of the total number of newspapers published by A?

  9. Question 9

    Read the following pie chart and bar graph carefully and answer the questions given below. The bar graph shows total number of magazines and newspapers published by five different publishers. The pie chart shows the percentage distribution of the newspapers published by these publishers.

    Note: The total number of magazines published by A is 50.

    chart

    chart

    The total number of newspapers published by G is 4X more than that of E and the total number of magazines published by G is X less than that of A, then find the total number of newspapers and magazines together published by G.

  10. Question 10

    Read the following pie chart and bar graph carefully and answer the questions given below. The bar graph shows total number of magazines and newspapers published by five different publishers. The pie chart shows the percentage distribution of the newspapers published by these publishers.

    Note: The total number of magazines published by A is 50.

    chart

    chart

    The total number of magazines published by B and F together \(12X\). Find the average number of magazines published by F and D.

Recommended courses for Banking

All Banking courses
Chat with an academic counsellor on WhatsApp