
Skip to content

Practice SBI PO 2023 Prelims Quant PYQ – 6 Nov 2023 Shift 1 (35 Questions with Solutions)

35 questions. Choose an option and see at once whether it was right, with the correct answer and a worked solution. No timer, and nothing to submit.

0 of 35 answered

0 correct0 wrong

Answers here are not saved.Sign in to track your progress

  1. Question 1

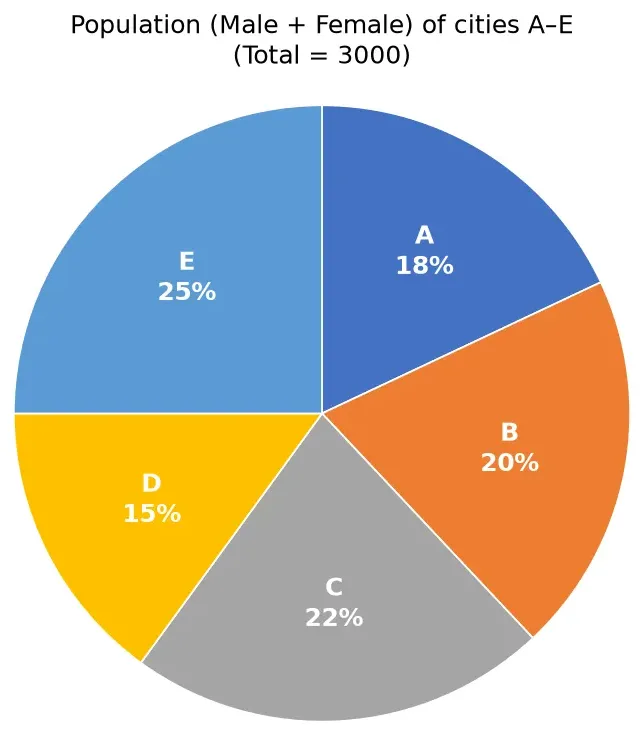
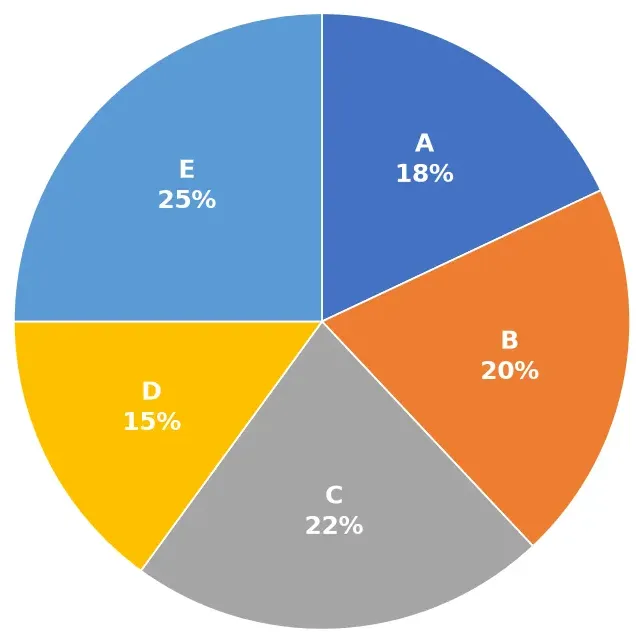
    The following pie chart shows the percentage distribution of the population (Male + Female) living in cities A, B, C, D and E. Total population of the five cities = 3000.
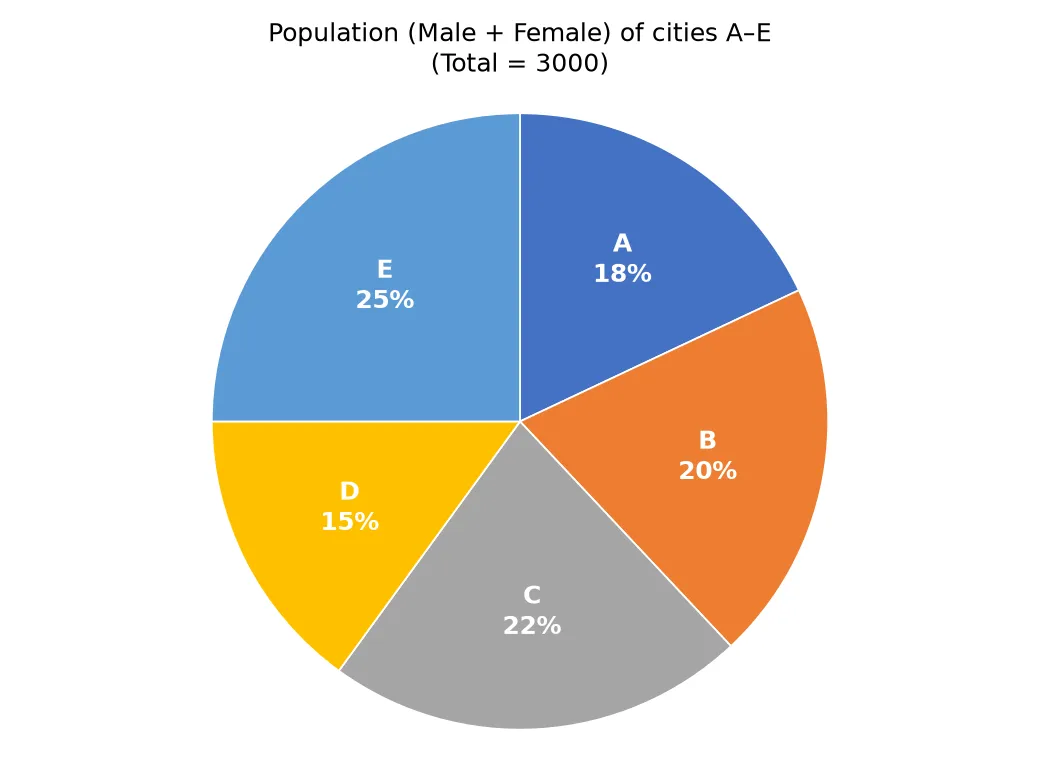
    chart

    The table shows the difference between the number of males and females living in the five cities.

    CityDifference between males and females
    A60
    B100
    C100
    D50
    E210

    Note: The number of males is more than the number of females in every city.

    20% and 25% of the males in city D and E respectively are below the age of 25, and 60% and 66.66% of the females in city D and E respectively are above the age of 25. Find the total number of persons (Male + Female) in D and E below the age of 25.
  2. Question 2

    The following pie chart shows the percentage distribution of the population (Male + Female) living in cities A, B, C, D and E. Total population of the five cities = 3000.

    chart

    The table shows the difference between the number of males and females living in the five cities.

    CityDifference between males and females
    A60
    B100
    C100
    D50
    E210

    Note: The number of males is more than the number of females in every city.

    If \(\dfrac{3}{7}\) of the males in the city B and \(\dfrac{2}{5}\) of the females in the city B are having two wheelers and remaining have four wheelers , Find the difference between the \(\dfrac{4}{5}\) of the number of males having four wheelers in city B and females having four wheelers in city B.

  3. Question 3

    The following pie chart shows the percentage distribution of the population (Male + Female) living in cities A, B, C, D and E. Total population of the five cities = 3000.

    chart

    The table shows the difference between the number of males and females living in the five cities.

    CityDifference between males and females
    A60
    B100
    C100
    D50
    E210

    Note: The number of males is more than the number of females in every city.

    If the number of males living in the city C is increased by \(x\) and the number of females living in the same city is increased by \((x - 50)\) then then the ratio of males to females becomes 3: 2. Find the value of \(x.\)

  4. Question 4

    The following pie chart shows the percentage distribution of the population (Male + Female) living in cities A, B, C, D and E. Total population of the five cities = 3000.

    chart

    The table shows the difference between the number of males and females living in the five cities.

    CityDifference between males and females
    A60
    B100
    C100
    D50
    E210

    Note: The number of males is more than the number of females in every city.

    Number of males living in city F is 20 more than the average males living in city C and city E and the number of females living in city F is 40 more than the average females living in city A and C. Find the total persons living in the city F.

  5. Question 5

    The following pie chart shows the percentage distribution of the population (Male + Female) living in cities A, B, C, D and E. Total population of the five cities = 3000.

    chart

    The table shows the difference between the number of males and females living in the five cities.

    CityDifference between males and females
    A60
    B100
    C100
    D50
    E210

    Note: The number of males is more than the number of females in every city.

    Find the ratio between the number of males living in city A and B to the number of females living in the city C and E.

  6. Question 6

    The following pie chart shows the percentage distribution of the population (Male + Female) living in cities A, B, C, D and E. Total population of the five cities = 3000.

    chart

    The table shows the difference between the number of males and females living in the five cities.

    CityDifference between males and females
    A60
    B100
    C100
    D50
    E210

    Note: The number of males is more than the number of females in every city.

    In each city, the literacy rate among males is 70%, and among females, it is 60%. Calculate the total number of literate people in each city and determine which city has the highest literacy rate (literate people as a percentage of the total population of the city).

  7. Question 7

    The perimeter of the semi-circular garden is equal to the perimeter of the rectangular field whose length and breadth is \(x\) \(m\) and \((x - 12)\text{ m},\) respectively. If the area of the rectangle field is \(1260 \text{ m}^{2}\). Then, find the cost of fencing of the semi-circular garden at the rate of Rs. 15 per \(m?\)

  8. Question 8

    A lent out Rs. 5000 and Rs. 'A' on compound interest for 3 years and 4 years respectively at the rate of interest of 10%. The difference between compound interest is Rs. 2986. Find the value of A.

  9. Question 9

    What should come in the place of question mark '?' in the following number series ?

    123, 187, 219, 235, 243, ?

  10. Question 10

    What should come in the place of question mark '?' in the following number series ? 13, 13, 14, 18, 45, 61, ?

Recommended courses for Banking

All Banking courses
Chat with an academic counsellor on WhatsApp