
Skip to content

Practice SBI PO 2023 Prelims Quant PYQ – 1 Nov 2023 Shift 1 (35 Questions with Solutions)

35 questions. Choose an option and see at once whether it was right, with the correct answer and a worked solution. No timer, and nothing to submit.

0 of 35 answered

0 correct0 wrong

Answers here are not saved.Sign in to track your progress

  1. Question 1

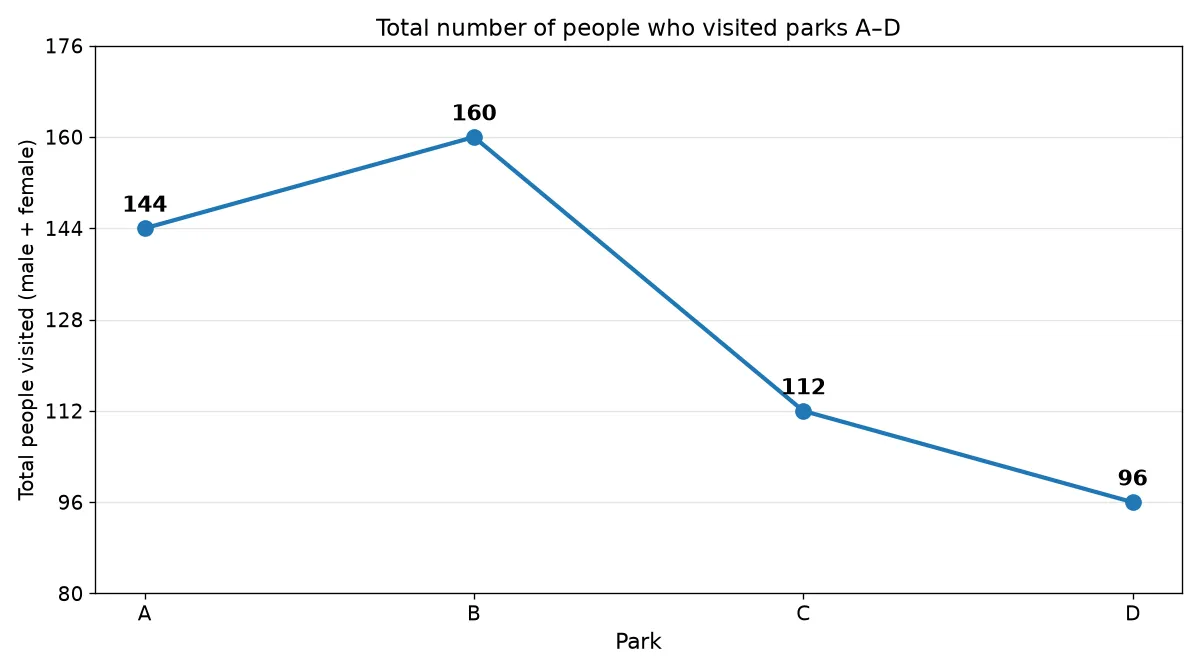
    Directions: The line graph given below shows the total number of people (male + female) who visited four different parks (A, B, C and D), and the table shows the fraction of males out of the total people who visited these four parks. Read the data carefully and answer the question.
    chart

    ParkFraction of males
    A\(\dfrac{2}{3}\)
    B\(\dfrac{5}{8}\)
    C\(\dfrac{4}{7}\)
    D\(\dfrac{3}{4}\)

    If total number of females visited park E are 75% of total number of males visited park A & C together and total number of males visited park E are 25% more than total females visited park C, then find total people visited park E.


  2. Question 2

    Directions: The line graph given below shows the total number of people (male + female) who visited four different parks (A, B, C and D), and the table shows the fraction of males out of the total people who visited these four parks. Read the data carefully and answer the question.

    chart

    ParkFraction of males
    A\(\dfrac{2}{3}\)
    B\(\dfrac{5}{8}\)
    C\(\dfrac{4}{7}\)
    D\(\dfrac{3}{4}\)

    The ratio local and outside people visited park B is \(7 : 1\) respectively, while the ratio of total local and outside females visited park B is \(5 : 1\) respectively. Find the ratio of outside to local males visited park B.

  3. Question 3

    Directions: The line graph given below shows the total number of people (male + female) who visited four different parks (A, B, C and D), and the table shows the fraction of males out of the total people who visited these four parks. Read the data carefully and answer the question.

    chart

    ParkFraction of males
    A\(\dfrac{2}{3}\)
    B\(\dfrac{5}{8}\)
    C\(\dfrac{4}{7}\)
    D\(\dfrac{3}{4}\)

    Find the difference between average number of females visited park A, C & D and total number of males visited park B.

  4. Question 4

    Directions: The line graph given below shows the total number of people (male + female) who visited four different parks (A, B, C and D), and the table shows the fraction of males out of the total people who visited these four parks. Read the data carefully and answer the question.

    chart

    ParkFraction of males
    A\(\dfrac{2}{3}\)
    B\(\dfrac{5}{8}\)
    C\(\dfrac{4}{7}\)
    D\(\dfrac{3}{4}\)

    If there is discount of 20% on each ticket for females as compare to male and total revenue received by park D from all the people is Rs 2280, then find the price of each ticket for female.

  5. Question 5

    Directions: The line graph given below shows the total number of people (male + female) who visited four different parks (A, B, C and D), and the table shows the fraction of males out of the total people who visited these four parks. Read the data carefully and answer the question.

    chart

    ParkFraction of males
    A\(\dfrac{2}{3}\)
    B\(\dfrac{5}{8}\)
    C\(\dfrac{4}{7}\)
    D\(\dfrac{3}{4}\)

    If average number of females visited park A, B & F are 60, then find total number of females visited park F are what percent of total number of males visited park A.

  6. Question 6

    Directions: The line graph given below shows the total number of people (male + female) who visited four different parks (A, B, C and D), and the table shows the fraction of males out of the total people who visited these four parks. Read the data carefully and answer the question.

    chart

    ParkFraction of males
    A\(\dfrac{2}{3}\)
    B\(\dfrac{5}{8}\)
    C\(\dfrac{4}{7}\)
    D\(\dfrac{3}{4}\)

    Total number of females visited park A and D together is what percent more than total number of females visited park B.

  7. Question 7

    Directions: The table given below shows the average number of articles (A, B and C) sold by Pesto company in three different months. It also shows the percentage of article A sold out of the total number of articles sold in these months, and the total number of article C sold in these months. Read the table carefully and answer the question.

    MonthAverage number of articles (A, B, C) soldArticle A (% of total sold)Article C sold
    April10040%100
    May12030%70
    June7225%80

    In month of July, total number of articles A sold by Pesto are 25% more than the average number of articles B sold in the month of May and June. If the sum of the article B and C sold by Pesto in July are 30% more than the articles B sold by Pesto in April, then find the difference in the number of articles B sold in July to that of in April.

  8. Question 8

    Directions: The table given below shows the average number of articles (A, B and C) sold by Pesto company in three different months. It also shows the percentage of article A sold out of the total number of articles sold in these months, and the total number of article C sold in these months. Read the table carefully and answer the question.

    MonthAverage number of articles (A, B, C) soldArticle A (% of total sold)Article C sold
    April10040%100
    May12030%70
    June7225%80

    Number of articles C sold in April and June together are what percentage (approx.) of the number of articles A sold in May.

  9. Question 9

    Directions: The table given below shows the average number of articles (A, B and C) sold by Pesto company in three different months. It also shows the percentage of article A sold out of the total number of articles sold in these months, and the total number of article C sold in these months. Read the table carefully and answer the question.

    MonthAverage number of articles (A, B, C) soldArticle A (% of total sold)Article C sold
    April10040%100
    May12030%70
    June7225%80

    Find the ratio of the sum of the number of articles A and B together sold in May to the difference between the articles B and C sold in April.

  10. Question 10

    Directions: The table given below shows the average number of articles (A, B and C) sold by Pesto company in three different months. It also shows the percentage of article A sold out of the total number of articles sold in these months, and the total number of article C sold in these months. Read the table carefully and answer the question.

    MonthAverage number of articles (A, B, C) soldArticle A (% of total sold)Article C sold
    April10040%100
    May12030%70
    June7225%80

    If the price of each article at which articles A, B and C sold in the month of April are Rs. 10, Rs \(y\) and Rs. \((y + 20)\) respectively, then the total revenue generated by selling these articles in the month of April is Rs. 4100. Find the value of 3y.

Recommended courses for Banking

All Banking courses
Chat with an academic counsellor on WhatsApp