Skip to content

Practice IBPS PO 2025 Prelims Quant PYQ – 24 Aug 2025 Shift 1 (35 Questions with Solutions)

35 questions. Choose an option and see at once whether it was right, with the correct answer and a worked solution. No timer, and nothing to submit.

0 of 35 answered

0 correct0 wrong

Answers here are not saved.Sign in to track your progress

  1. Question 1

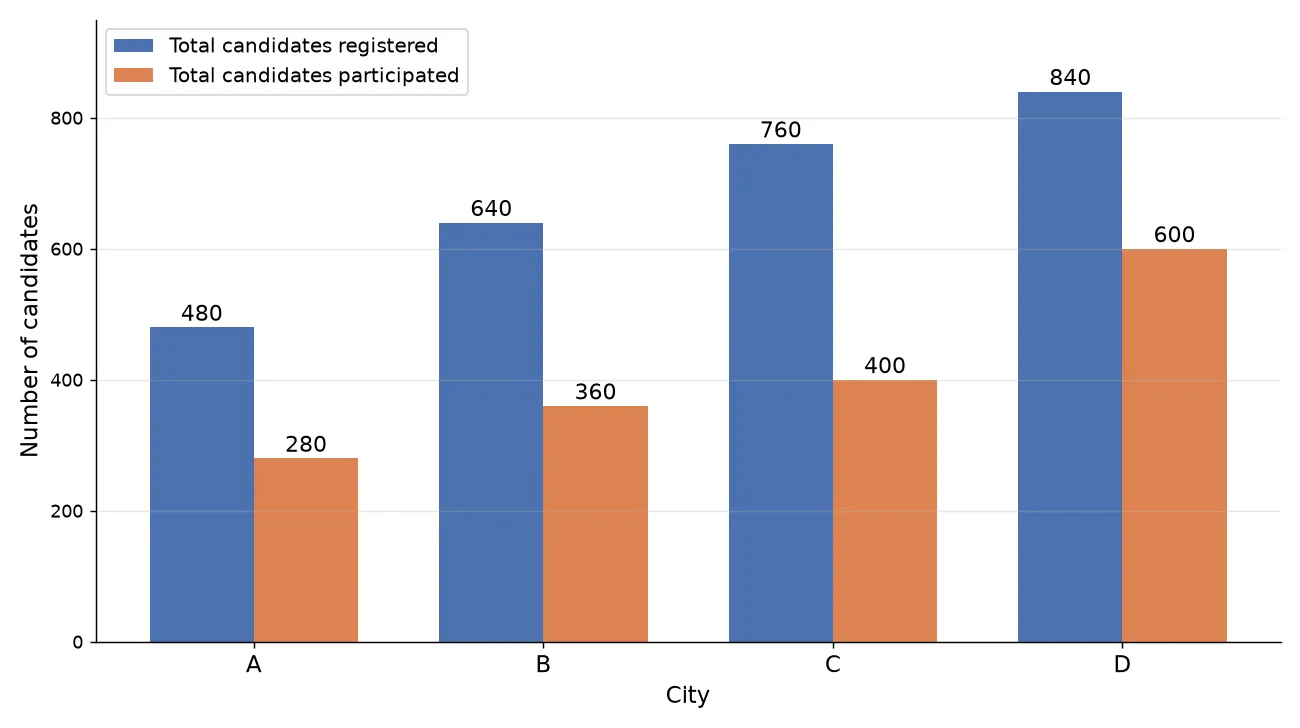
    Read the following bar graph carefully and answer the questions given below. The bar graph shows the total candidates registered and the total candidates who participated in an activity from four different cities.

    chart

    Find the ratio of the total candidates registered from C and the total candidates who did not participate from A.

  2. Question 2

    Read the following bar graph carefully and answer the questions given below. The bar graph shows the total candidates registered and the total candidates who participated in an activity from four different cities.

    chart

    Find the average number of candidates who did not participate from C and D.

  3. Question 3

    Read the following bar graph carefully and answer the questions given below. The bar graph shows the total candidates registered and the total candidates who participated in an activity from four different cities.

    chart

    If the total number of candidates who registered from E is 25% more than that of D and the number of candidates who participated from E is 60% of that of C, then find the difference between the number of candidates who did not participate from E and D.

  4. Question 4

    Read the following bar graph carefully and answer the questions given below. The bar graph shows the total candidates registered and the total candidates who participated in an activity from four different cities.

    chart

    If 40% of the candidates who participated from B qualify for the semifinals and only 25% of them qualify for the finals, then find the number of candidates (among the semifinalists) who did not qualify for the finals from B.

  5. Question 5

    Read the following bar graph carefully and answer the questions given below. The bar graph shows the total candidates registered and the total candidates who participated in an activity from four different cities.

    chart

    The total number of candidates who registered from A is what percentage more or less than the number of candidates who did not participate from C and D together?

  6. Question 6

    A man invested Rs 12500 in scheme A that offers simple interest at r% p.a. for two years, and the interest received from scheme A is invested in scheme B that offers compound interest at 10% p.a. for two years. If the amount received from scheme B is Rs 3630, then find \(r.\)

  7. Question 7

    Pipe A can fill 25% of a tank in 6 hours, and pipe B can fill 50% of the tank in 12 hours. Pipe C is an outlet pipe and empties the filled tank in 20 hours. If the tank is already 60% filled, then find the time taken by all the pipes together to fill the remaining tank.

  8. Question 8

    Two cars A and B start simultaneously from cities P and Q toward each other. The distance between P and Q is 480 km. Car A covers the distance in 4 hours, and car B covers the same distance in 6 hours. After how much time from the start will they meet?

  9. Question 9

    Read the following table carefully and answer the questions given below.

    The table shows the number of males out of the total employees (males + females) in four different companies. The table also shows the number of female managers out of the total number of females in these companies.

    CompanyMales out of total employeesFemale managers out of total females
    A26060
    B34090
    C22070
    D390140

    Note: (I) Total employees in only companies B and D together is more than 510.

    (II) The difference between the number of males and the number of females in each company is 130 (males > females).

    Find the average number of non-manager female employees in B and A.

  10. Question 10

    Read the following table carefully and answer the questions given below.

    The table shows the number of males out of the total employees (males + females) in four different companies. The table also shows the number of female managers out of the total number of females in these companies.

    CompanyMales out of total employeesFemale managers out of total females
    A26060
    B34090
    C22070
    D390140

    Note: (I) Total employees in only companies B and D together is more than 510.

    (II) The difference between the number of males and the number of females in each company is 130 (males > females).

    If the ratio of male manager employees to non-manager male employees in C is \(7 : 3\) respectively, then the total non-manager male employees in C is how many more or less than the total female employees in A?

Recommended courses for Banking

All Banking courses
Chat with an academic counsellor on WhatsApp