
Skip to content

Practice SBI Clerk 2025 Prelims Quant PYQ – 20 Sep 2025 Shift 2 (34 Questions with Solutions)

34 questions. Choose an option and see at once whether it was right, with the correct answer and a worked solution. No timer, and nothing to submit.

0 of 34 answered

0 correct0 wrong

Answers here are not saved.Sign in to track your progress

  1. Question 1

    Directions: The table given below shows the number of cheesecakes sold by two shops A and B on three different days (Saturday, Sunday and Monday).

    DayAB
    Saturday125325
    Sunday175275
    Monday200100

    Cheesecakes sold by A on Sunday and Monday together are what percentage of the total cheesecakes sold by B on Saturday and Sunday?

  2. Question 2

    Directions: The table given below shows the number of cheesecakes sold by two shops A and B on three different days (Saturday, Sunday and Monday).

    DayAB
    Saturday125325
    Sunday175275
    Monday200100

    Find the ratio of cheesecake sold by B on Saturday to Monday.

  3. Question 3

    Directions: The table given below shows the number of cheesecakes sold by two shops A and B on three different days (Saturday, Sunday and Monday).

    DayAB
    Saturday125325
    Sunday175275
    Monday200100

    The average number of cheesecakes sold by A on Monday and Tuesday is 300. The number of cheesecakes sold by A on Tuesday is what percentage more/less than the number sold by B on Monday?

  4. Question 4

    Directions: The table given below shows the number of cheesecakes sold by two shops A and B on three different days (Saturday, Sunday and Monday).

    DayAB
    Saturday125325
    Sunday175275
    Monday200100

    Find the average cheesecake sold by B on Saturday and A on Sunday.

  5. Question 5

    Directions: The table given below shows the number of cheesecakes sold by two shops A and B on three different days (Saturday, Sunday and Monday).

    DayAB
    Saturday125325
    Sunday175275
    Monday200100

    If A made 700 cheesecakes (sold + unsold) on the given days, then the unsold cheesecakes of A are how many less than the cheesecakes sold by B on Saturday and Sunday?

  6. Question 6

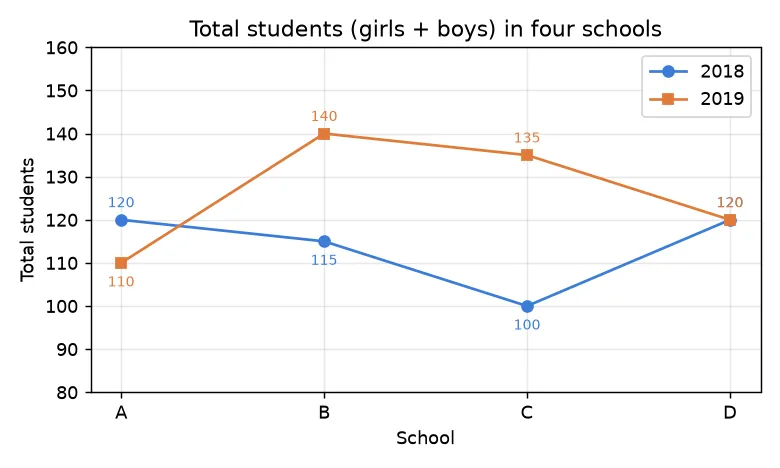
    Directions: The line graph shows the total number of students (girls + boys) in two different years, 2018 and 2019, in four different schools A, B, C and D.

    chart

    Find the ratio of total students in 2018 to 2019.

  7. Question 7

    Directions: The line graph shows the total number of students (girls + boys) in two different years, 2018 and 2019, in four different schools A, B, C and D.

    chart

    Find the total students in B in both the years is what percentage more than total students in A in 2018.

  8. Question 8

    Directions: The line graph shows the total number of students (girls + boys) in two different years, 2018 and 2019, in four different schools A, B, C and D.

    chart

    The average number of students in A in the year 2018, 2019 & 2020 is 120. Find the total students in A in the year 2020.

  9. Question 9

    Directions: The line graph shows the total number of students (girls + boys) in two different years, 2018 and 2019, in four different schools A, B, C and D.

    chart

    In school E, total students in 2019 and 2018 together are 165 more than that of C. The ratio of students in 2019 to 2018 is \(3 : 2,\) find the difference between students in 2019 and 2018 in E.

  10. Question 10

    Directions: The line graph shows the total number of students (girls + boys) in two different years, 2018 and 2019, in four different schools A, B, C and D.

    chart

    If the ratio of girl to boys in school D in the year 2018 is \(1 : 3,\) Then find the boys in school D in the year 2018.

Recommended courses for Banking

All Banking courses
Chat with an academic counsellor on WhatsApp