
Skip to content

Practice SBI Clerk 2024 Prelims Quant PYQ – 28 Feb 2025 Shift 1 (35 Questions with Solutions)

35 questions. Choose an option and see at once whether it was right, with the correct answer and a worked solution. No timer, and nothing to submit.

0 of 35 answered

0 correct0 wrong

Answers here are not saved.Sign in to track your progress

  1. Question 1

    Directions: The table given below shows the number of students (girls + boys) in four different classes (A, B, C and D).

    ClassGirlsBoys
    A2445
    B6090
    C1236
    D8472

    The average number of boys in C and B is what percent less than the number of girls in D?
  2. Question 2

    Directions: The table given below shows the number of students (girls + boys) in four different classes (A, B, C and D).

    ClassGirlsBoys
    A2445
    B6090
    C1236
    D8472

    Find the ratio of girls in B and C together to boys in D.

  3. Question 3

    Directions: The table given below shows the number of students (girls + boys) in four different classes (A, B, C and D).

    ClassGirlsBoys
    A2445
    B6090
    C1236
    D8472

    In class F, the number of boys is 20% more than that in B and number of girls is \(\dfrac{5}{6}\) of girls in C. Find the total number of students in F.

  4. Question 4

    Directions: The table given below shows the number of students (girls + boys) in four different classes (A, B, C and D).

    ClassGirlsBoys
    A2445
    B6090
    C1236
    D8472

    Only 25% of the students of class C are present. Find the number of absent students in class C.

  5. Question 5

    Directions: The table given below shows the number of students (girls + boys) in four different classes (A, B, C and D).

    ClassGirlsBoys
    A2445
    B6090
    C1236
    D8472

    The total number of students in B and A together is what percentage of the total girls in D (approx.)?

  6. Question 6

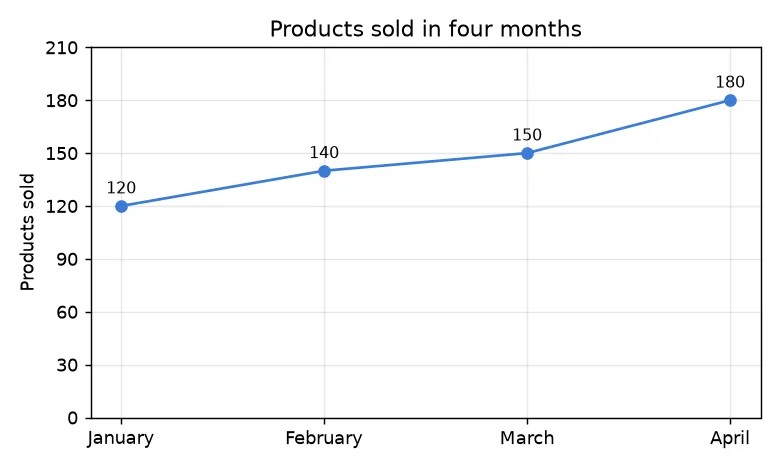
    Directions: The line graph given below shows the number of products sold in the months of January, February, March and April.

    chart

    The price of each product sold in January is Rs 20. If the price of each product sold in February is 20% more than that in January, find the revenue (in Rs) generated in February.

  7. Question 7

    Directions: The line graph given below shows the number of products sold in the months of January, February, March and April.

    chart

    In June, the number of products sold is the average of the numbers sold in January and February. If only 20% of the products available in June are sold, find the number of unsold products in June.

  8. Question 8

    Directions: The line graph given below shows the number of products sold in the months of January, February, March and April.

    chart

    Find the average number of products sold in the given months.

  9. Question 9

    Directions: The line graph given below shows the number of products sold in the months of January, February, March and April.

    chart

    Find the ratio of products sold in January and February together to products sold in April.

  10. Question 10

    Directions: The line graph given below shows the number of products sold in the months of January, February, March and April.

    chart

    The number of products sold in March is what percentage of the number sold in January?

Recommended courses for Banking

All Banking courses
Chat with an academic counsellor on WhatsApp