Question 1
Directions Study the following line graph carefully and answer the questions given below.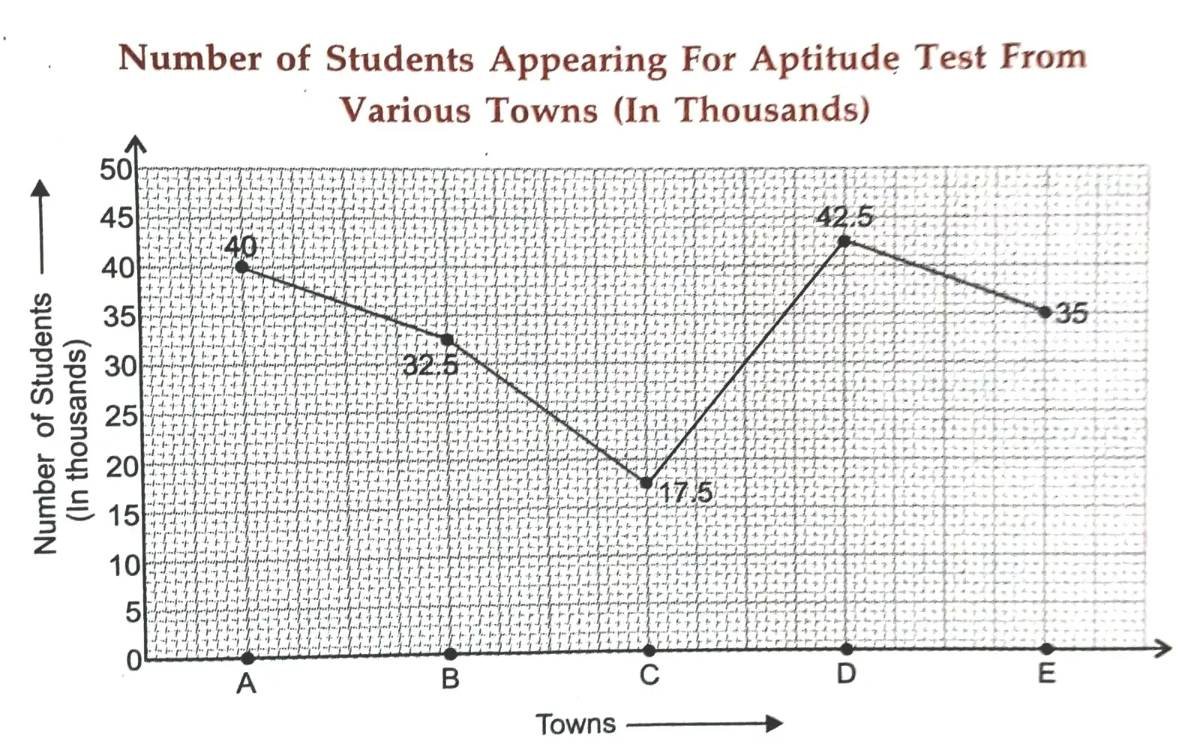
What is the ratio of the number of students appearing for the Aptitude Test from Town B to that from Town A?

Programs for CAT & Other MBA Exams
View All →Featured Tools & Quick Tests
Free Aptitude Assessment Test
See where you stand before you pick a course, with an exam-style test and an instant score.
Take Free Test68 questions. Choose an option and see at once whether it was right, with the correct answer and a worked solution. No timer, and nothing to submit.
0 of 68 answered
0 correct0 wrong
Directions Study the following line graph carefully and answer the questions given below.
What is the ratio of the number of students appearing for the Aptitude Test from Town B to that from Town A?
Directions Study the following line graph carefully and answer the questions given below.
What is the average number of students appearing for the Aptitude Test from all the towns together?
Directions Study the following line graph carefully and answer the questions given below.
The number of students appearing for the Aptitude Test from Town E is approximately what per cent of the total number of students appearing for the Aptitude Test from all the towns together?
Directions Study the following line graph carefully and answer the questions given below.
What is the ratio of the number of students appearing for the Aptitude Test from Towns C and D together to the number of students appearing for the Aptitude Test from Towns A, D and E together?
Directions Study the following line graph carefully and answer the questions given below.
The number of students appearing for the Aptitude Test from Town D is approximately what percentage of the number of students appearing for the Aptitude Test from Town C?
Directions Study the following graph and answer the questions that follow.
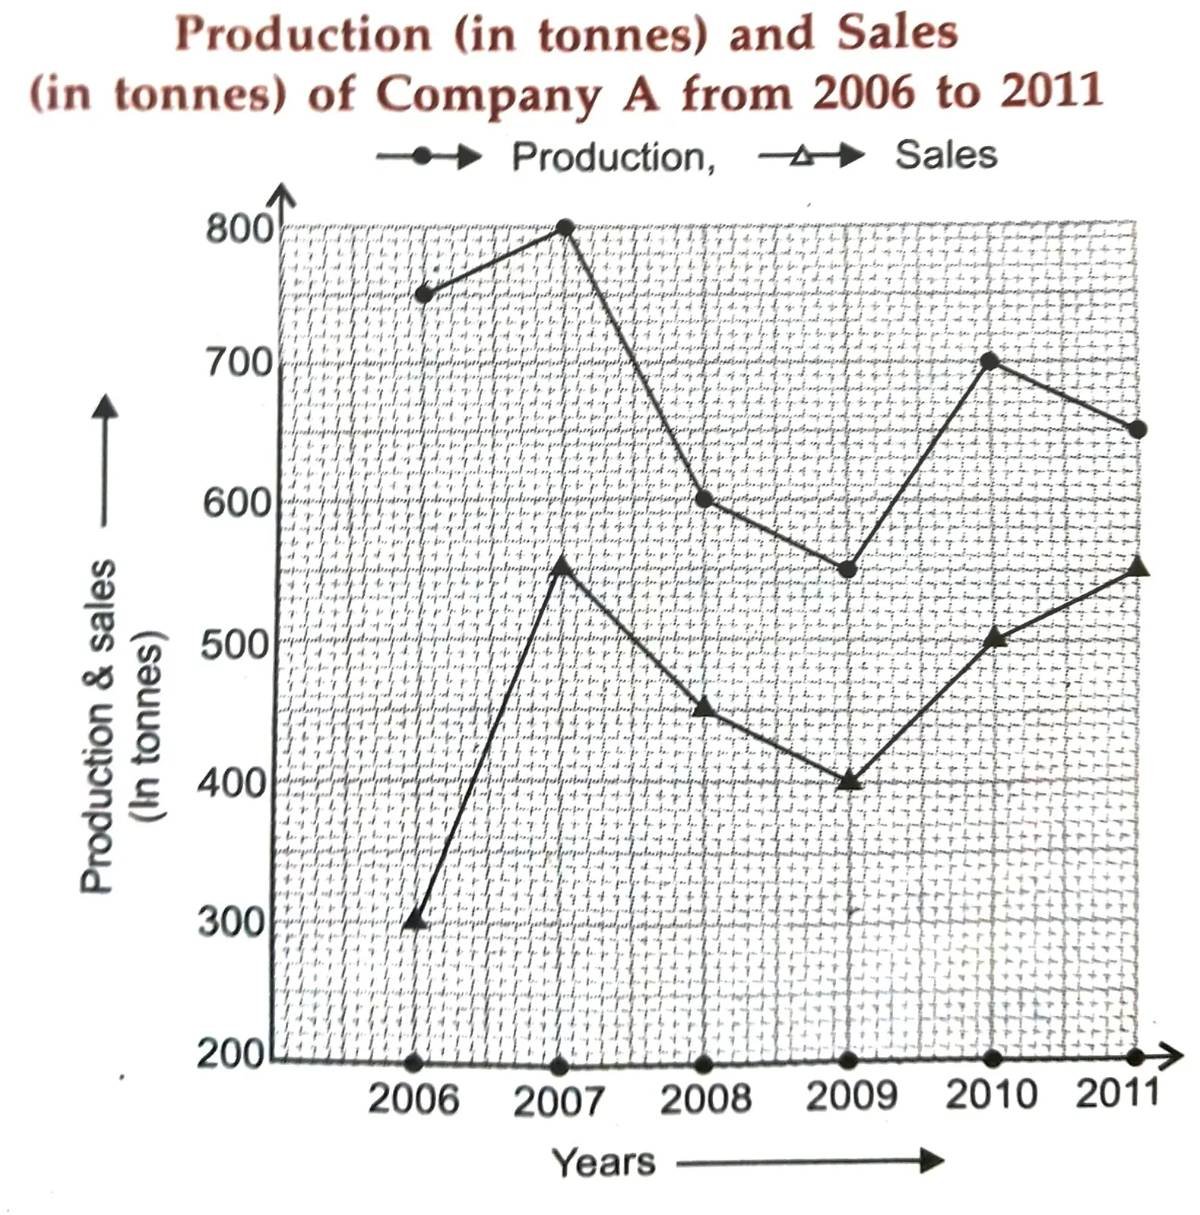
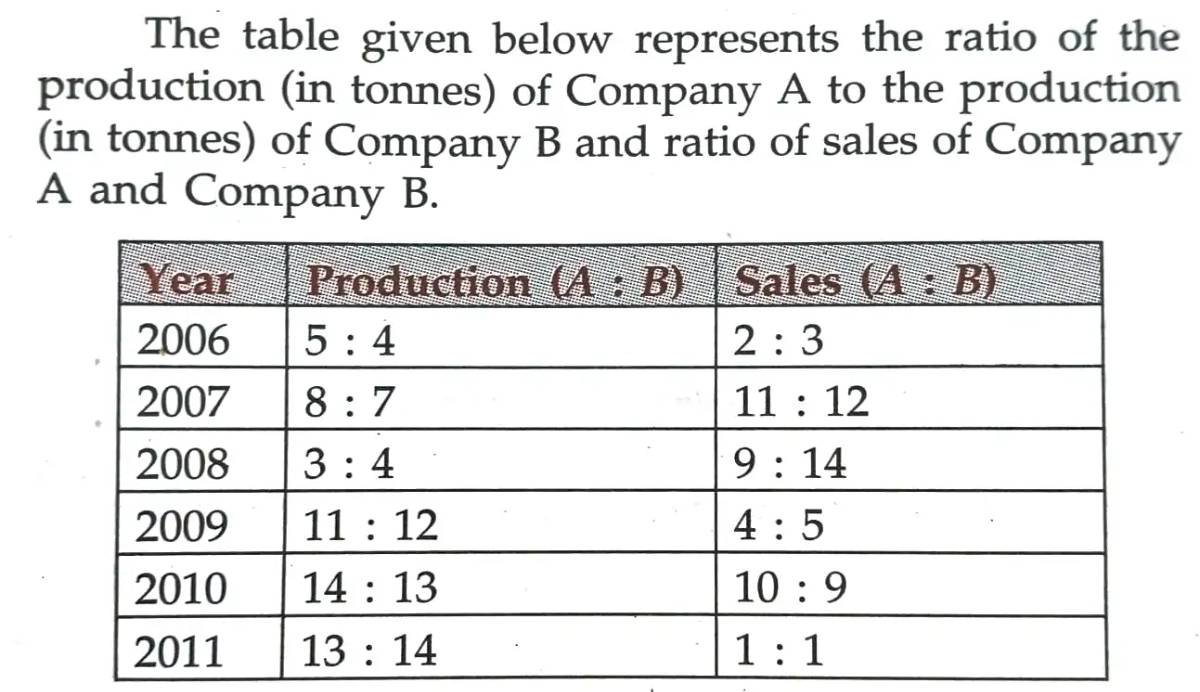
What is the approximate percentage increase in the production of Company A from 2009 to 2010?
Directions Study the following graph and answer the questions that follow.
The sales of Company A in the year 2009 was approximately what percent of its production in the same year?
Directions Study the following graph and answer the questions that follow.
What is the average production of Company B (in tonnes) from the year 2006 to the year 2011?
Directions Study the following graph and answer the questions that follow.
What is the ratio of the total production of Company A to the total sales of Company A?
Directions Study the following graph and answer the questions that follow.
What is the ratio of production of Company B in the year 2006 to production of Company B in the year 2008?