
Skip to content
Aptitude360

Data Interpretation Tabulation Level - 1

85 questions. Choose an option and see at once whether it was right, with the correct answer and a worked solution. No timer, and nothing to submit.

0 of 85 answered

0 correct0 wrong

  1. Question 1

    Directions

    Study the given table carefully and answer the questions that follow.
    Number of candidates appeared and qualified for a test (in hundreds) in 6 different years from 5 different zones
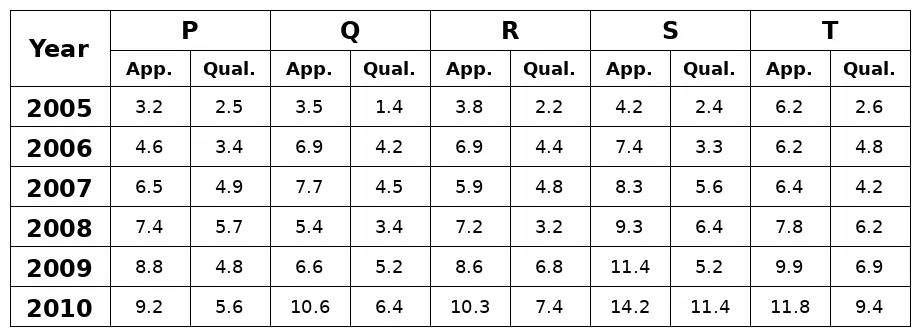

    In which years was in zones the difference between the appeared candidates and qualified candidates the second lowest?
  2. Question 2

    Directions

    Study the given table carefully and answer the questions that follow.

    Number of candidates appeared and qualified for a test (in hundreds) in 6 different years from 5 different zones


    The number of candidates who qualified the test from zone R in the year 2010 was approximately what percentage of the number of candidates who appeared from zone Q in the year 2008?

  3. Question 3

    Directions

    Study the given table carefully and answer the questions that follow.

    Number of candidates appeared and qualified for a test (in hundreds) in 6 different years from 5 different zones


    What was the average number of candidates appeared from zone T over all the years together?

  4. Question 4

    Directions

    Study the given table carefully and answer the questions that follow.
    Number of candidates appeared and qualified for a test (in hundreds) in 6 different years from 5 different zones


    What was the ratio of the number of candidates appeared from zone P in the year 2005 to the number of candidates qualified from zone S in the year 2007?

  5. Question 5

    Directions

    Study the given table carefully and answer the questions that follow.
    Number of candidates appeared and qualified for a test (in hundreds) in 6 different years from 5 different zones


    From which zone was the total number of candidates who qualified the test, the second highest in the year?

  6. Question 6

    Directions
    Study the following table carefully and answer the questions that follow.
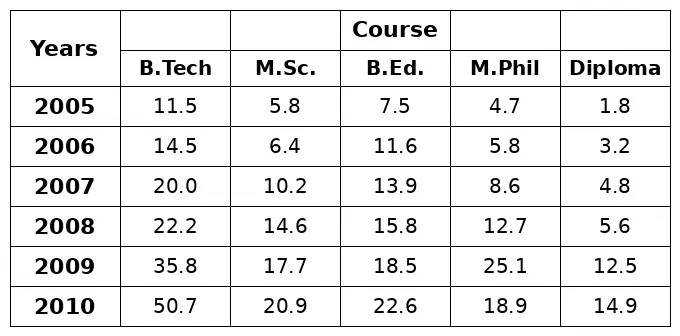
    Semester Fees (₹ thousands) for 5 Different Courses In 6 Different years


    What was the approximate per cent increase in the semester fees of B.Ed course in the year 2007 as compared to the previous year?

  7. Question 7

    Directions
    Study the following table carefully and answer the questions that follow.
    Semester Fees (₹ thousands) for 5 Different Courses In 6 Different years


    What was the average semester fee charged for M.Sc. course over all the years together?

  8. Question 8

    Directions
    Study the following table carefully and answer the questions that follow.
    Semester Fees (₹ thousands) for 5 Different Courses In 6 Different years


    What was the difference between the total semester fee charged for Diploma course over the years together and the fee charged for B.Tech Course in the year 2009?

  9. Question 9

    Directions
    Study the following table carefully and answer the questions that follow.
    Semester Fees (₹ thousands) for 5 Different Courses In 6 Different years


    The semester fee charged for M.Phil course in the year 2008 was approximately what percentage of the semester fee charged for M.Sc course in the year 2009?

  10. Question 10

    Directions
    Study the following table carefully and answer the questions that follow.
    Semester Fees (₹ thousands) for 5 Different Courses In 6 Different years


    What was the total semester fee charged for all the courses together in the year 2006?

Chat with an academic counsellor on WhatsApp