
Question 1
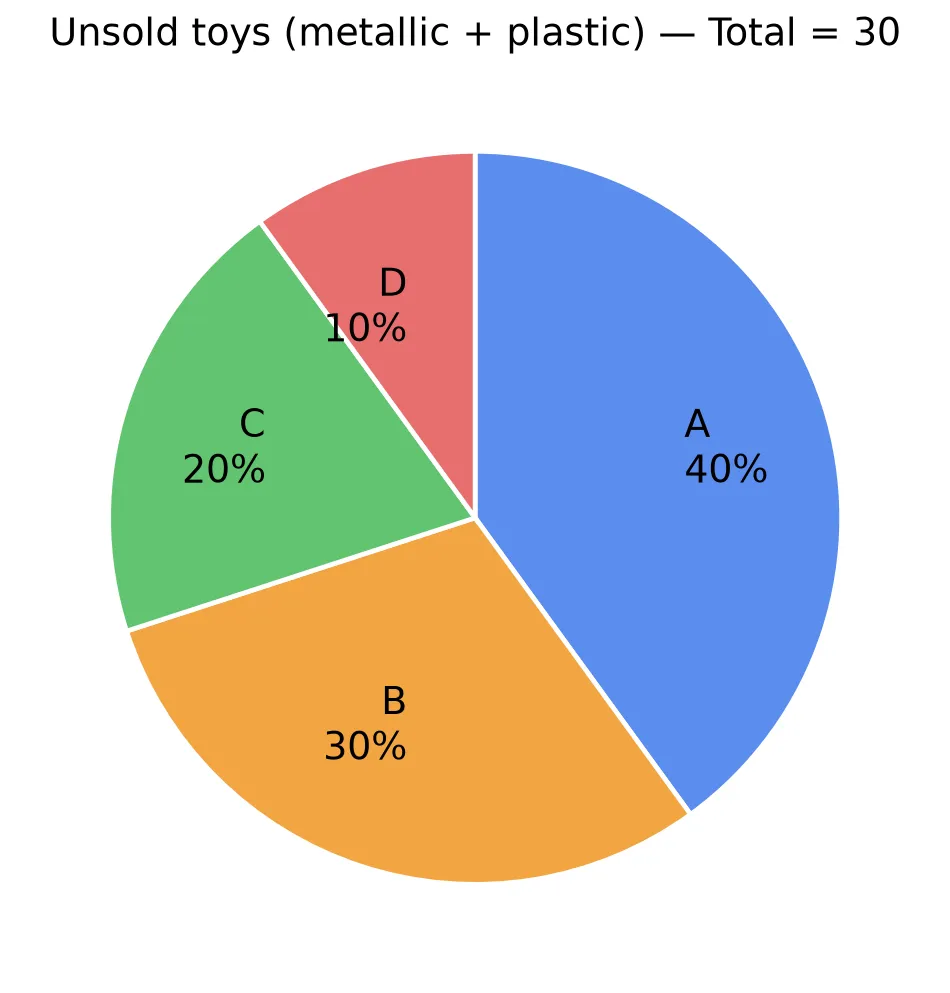
Directions: Read the following pie chart and table carefully and answer the questions given below. The pie chart shows the percentage distribution of total number of unsold toys (metallic and plastic) by four (A, B, C and D) different companies. The table shows the difference between the metallic and plastic toys sold by these four companies.
| Company | Difference between metallic and plastic toys sold |
|---|---|
| A | 2 |
| B | 12 |
| C | 3 |
| D | 5 |
Note: (i) Total toys (metallic and plastic) manufactured by A, B, C and D are 40, 33, 25, and 38 respectively.
(ii) Metallic sold are more than plastic toys sold by each company.
(iii) Total toys manufactured = Total toys (metallic and plastic) sold + total toys unsold (metallic and plastic)
Find the difference between the total number of metallic toys sold by A and C together and the total number of unsold toys by B and D together.