Skip to content
Aptitude360

SBI PO PYQ 2024 Quantitative Aptitude

30 questions. Choose an option and see at once whether it was right, with the correct answer and a worked solution. No timer, and nothing to submit.

0 of 30 answered

0 correct0 wrong

  1. Question 1

    (COMMON INFORMATION FOR QUESTIONS 1 TO 5)

    Read the following table carefully and answer the questions given below. The table shows total number of EV manufactured by five different companies. The table also shows the percentage of petrol vehicles manufactured out of the total vehicles (diesel, EV and Petrol) manufactured and the percentage of diesel vehicles manufactured out of the total petrol vehicles manufactured by these companies. 

    CompaniesTotal EV manufactured Percentage of petrol vehicles manufactured Percentage of diesel vehicles manufactured
    A6460%40%
    B12040%25%
    C17130%75%
    D30025%60%
    E2850%80%

    Q.   Find the difference between the total number of diesel vehicles manufactured by D and the total number of vehicles (diesel, EV, and petrol) manufactured by B.
  2. Question 2

    (COMMON INFORMATION FOR QUESTIONS 1 TO 5)

    Read the following table carefully and answer the questions given below. The table shows total number of EV manufactured by five different companies. The table also shows the percentage of petrol vehicles manufactured out of the total vehicles (diesel, EV and Petrol) manufactured and the percentage of diesel vehicles manufactured out of the total petrol vehicles manufactured by these companies. 

    Companies

    Total EV manufacturedPercentage of petrol vehicles manufactured Percentage of diesel vehicles manufactured
    A6460%40%
    B12040%25%
    C17130%75%
    D30025%60%
    E2850%80%


    Q.  The total number of petrol vehicles manufactured by E is what percentage more or less than the total number of diesel vehicles manufactured by D?

  3. Question 3

    (COMMON INFORMATION FOR QUESTIONS 1 TO 5)

    Read the following table carefully and answer the questions given below. The table shows total number of EV manufactured by five different companies. The table also shows the percentage of petrol vehicles manufactured out of the total vehicles (diesel, EV and Petrol) manufactured and the percentage of diesel vehicles manufactured out of the total petrol vehicles manufactured by these companies. 

    Companies

    Total EV manufacturedPercentage of petrol vehicles manufactured Percentage of diesel vehicles manufactured
    A6460%40%
    B12040%25%
    C17130%75%
    D30025%60%
    E2850%80%


    Q.  Find the ratio of the total number of vehicles (diesel, EV, and petrol) manufactured by C to the total number of EVs manufactured by B.

  4. Question 4

    (COMMON INFORMATION FOR QUESTIONS 1 TO 5)

    Read the following table carefully and answer the questions given below. The table shows total number of EV manufactured by five different companies. The table also shows the percentage of petrol vehicles manufactured out of the total vehicles (diesel, EV and Petrol) manufactured and the percentage of diesel vehicles manufactured out of the total petrol vehicles manufactured by these companies.

    Companies

    Total EV manufacturedPercentage of petrol vehicles manufactured Percentage of diesel vehicles manufactured
    A6460%40%
    B12040%25%
    C17130%75%
    D30025%60%
    E2850%80%


    Q.  The total number of vehicles (diesel, EV, and petrol) manufactured by F is 25% more than that of D, and the total number of petrol vehicles manufactured by F is half that of C. If the ratio of the total number of diesel vehicles manufactured by B to F is 12:19, respectively, then find the total number of EVs manufactured in F.

  5. Question 5

    (COMMON INFORMATION FOR QUESTIONS 6 TO 10)

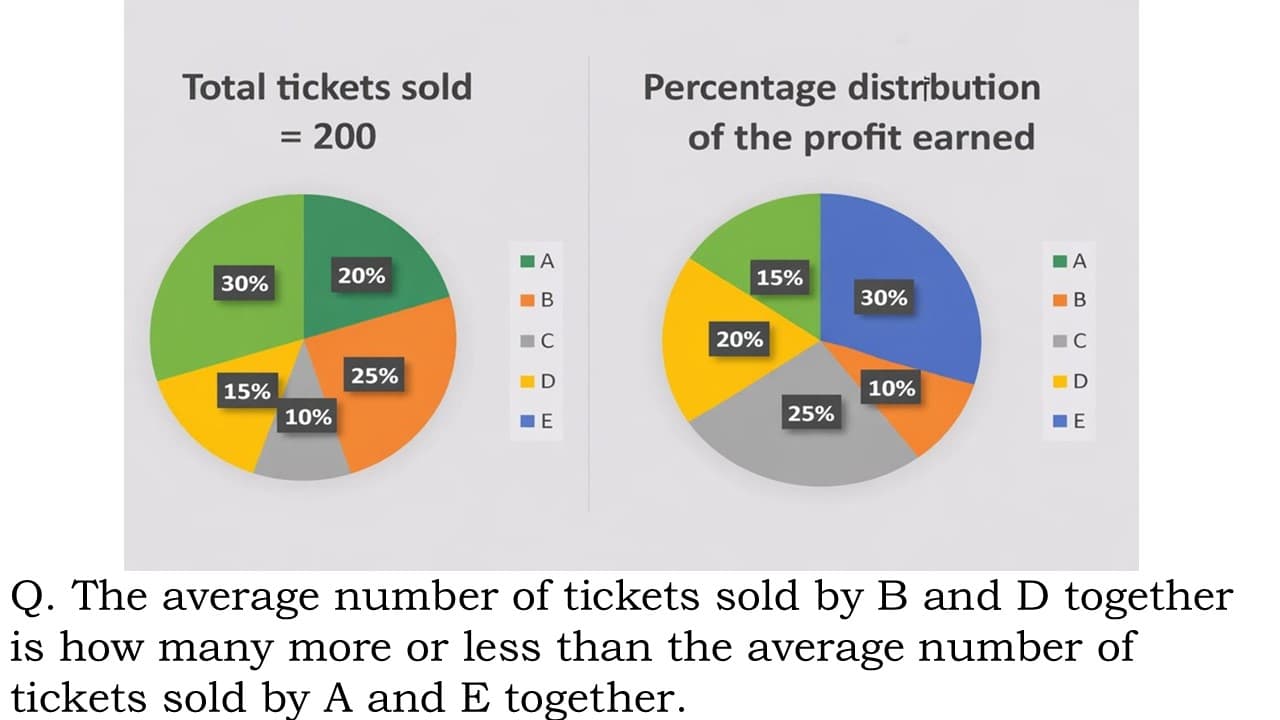
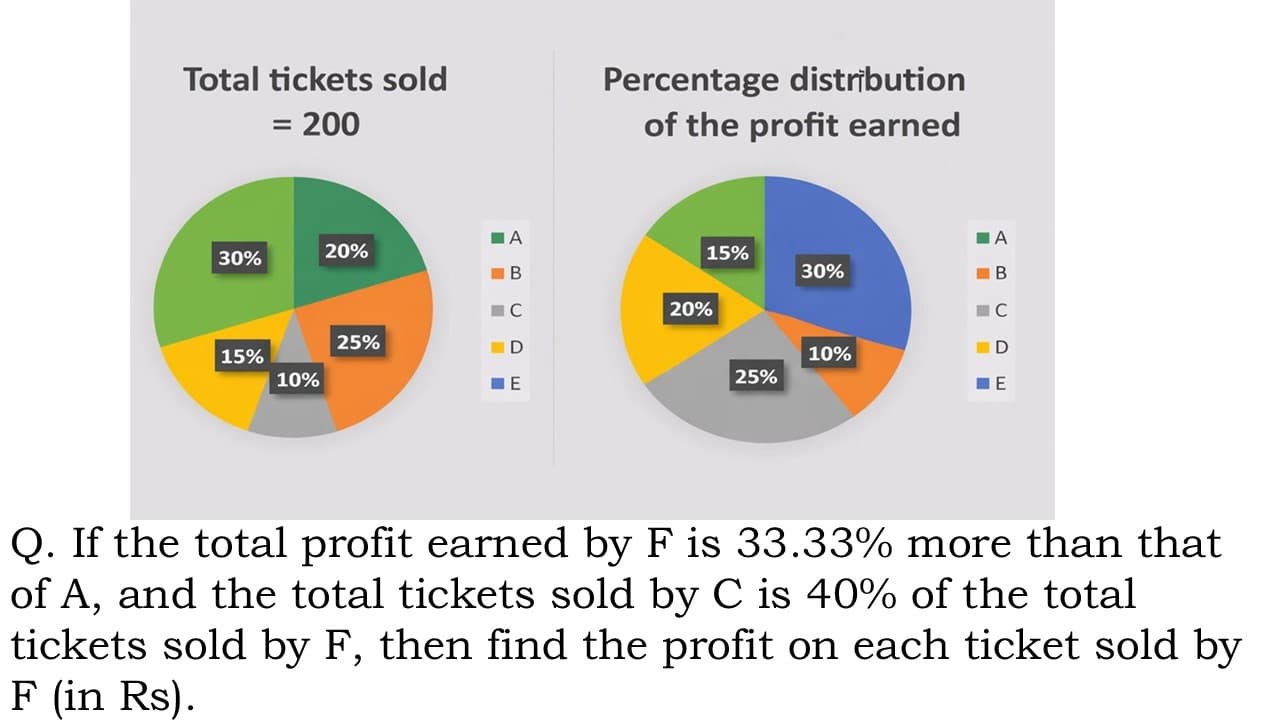
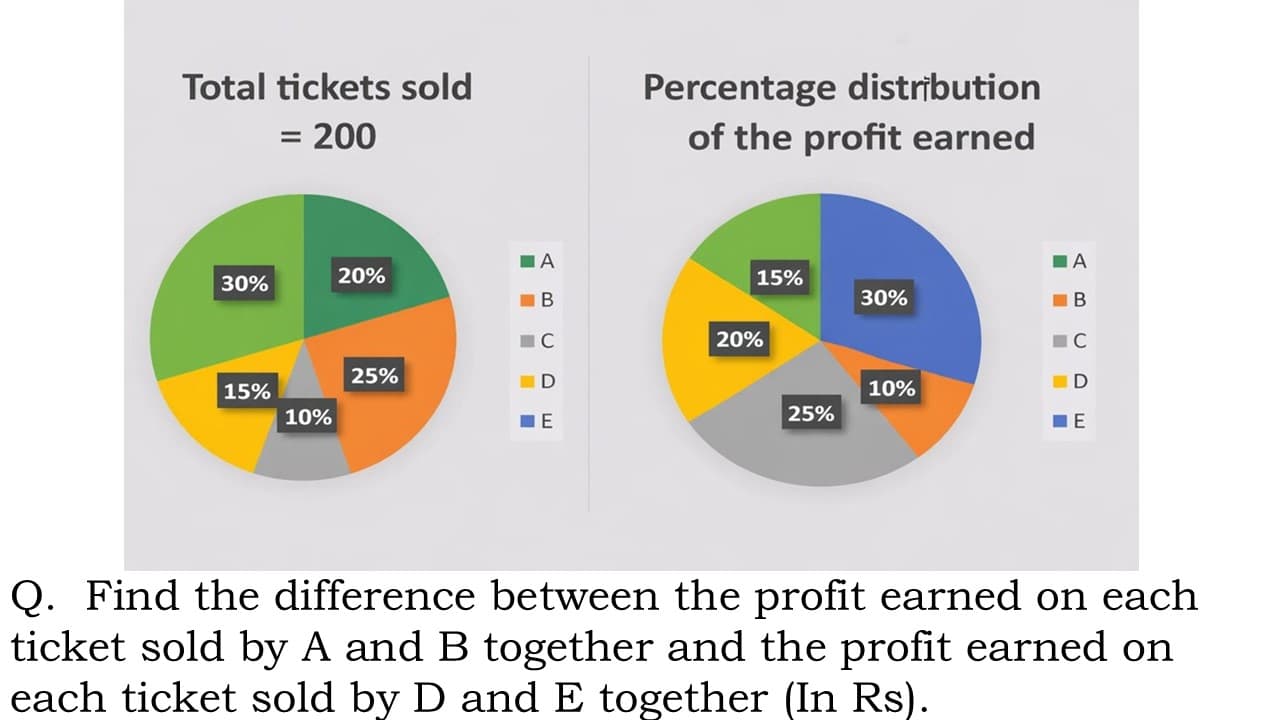
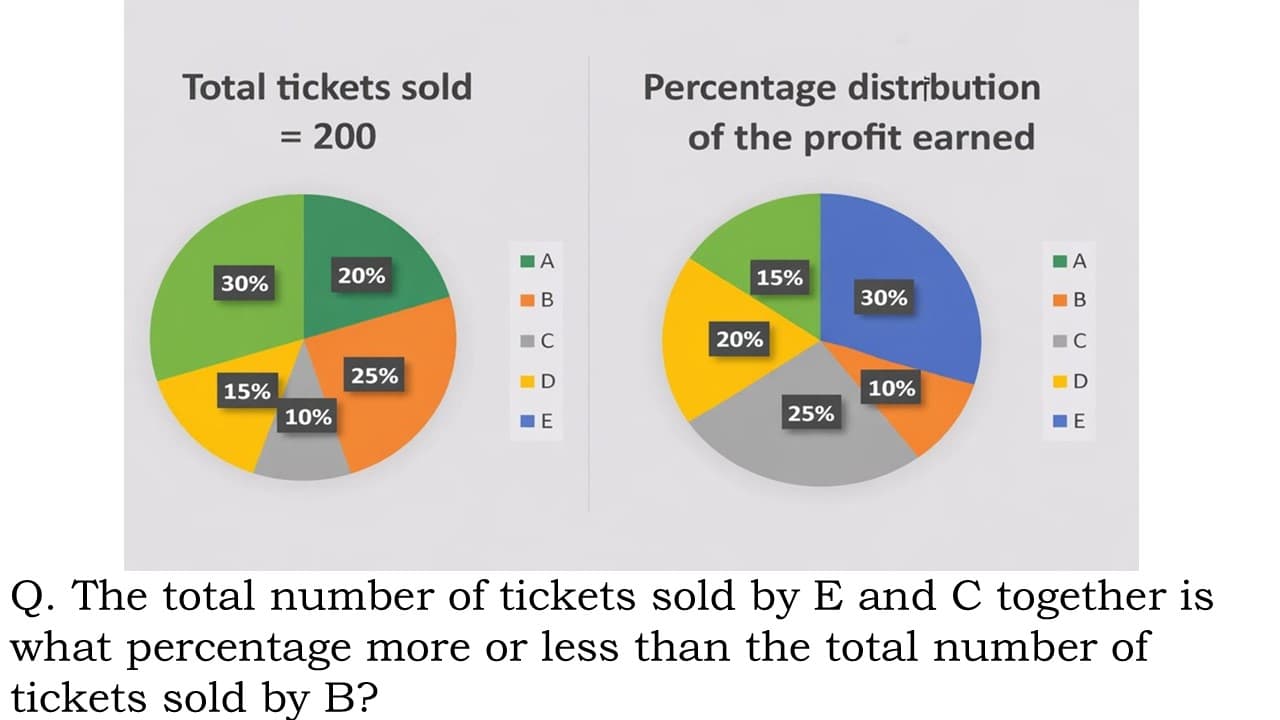
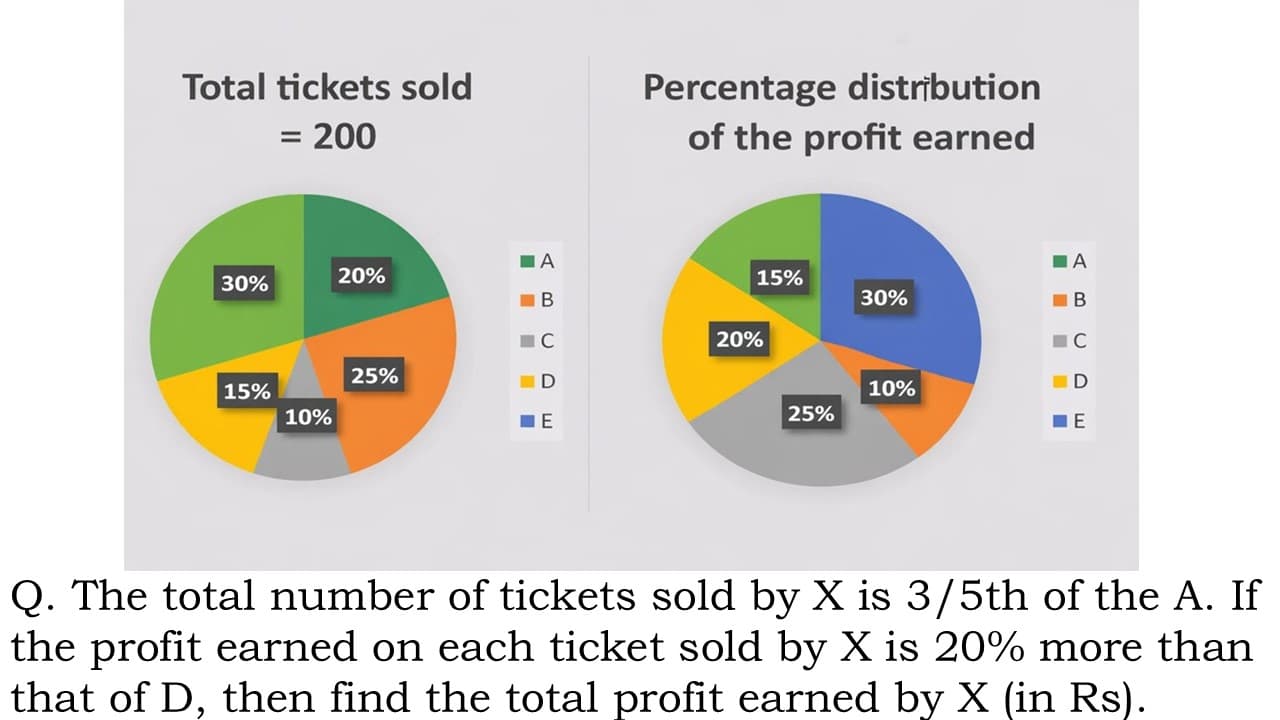
    Read the following pie charts carefully and answer the questions given below. The pie chart (I) shows the percentage distribution of the total number of tickets sold by five different cinema halls on Sunday. The pie chart (II) shows the percentage distribution of the profit earned by these cinema halls on Sunday.

    NOTE: The average profit of each ticket sold is Rs 30.

  6. Question 6

    (COMMON INFORMATION FOR QUESTIONS 6 TO 10)

    Directions (51-55): Read the following pie charts carefully and answer the questions given below. The pie chart (I) shows the percentage distribution of the total number of tickets sold by five different cinema halls on Sunday. The pie chart (II) shows the percentage distribution of the profit earned by these cinema halls on Sunday.

    NOTE: The average profit of each ticket sold is Rs 30.

  7. Question 7

    (COMMON INFORMATION FOR QUESTIONS 6 TO 10)

    Read the following pie charts carefully and answer the questions given below. The pie chart (I) shows the percentage distribution of the total number of tickets sold by five different cinema halls on Sunday. The pie chart (II) shows the percentage distribution of the profit earned by these cinema halls on Sunday.

    NOTE: The average profit of each ticket sold is Rs 30.

  8. Question 8

    (COMMON INFORMATION FOR QUESTIONS 6 TO 10)

    Read the following pie charts carefully and answer the questions given below. The pie chart (I) shows the percentage distribution of the total number of tickets sold by five different cinema halls on Sunday. The pie chart (II) shows the percentage distribution of the profit earned by these cinema halls on Sunday.

    NOTE: The average profit of each ticket sold is Rs 30.

  9. Question 9

    (COMMON INFORMATION FOR QUESTIONS 6 TO 10)

    Read the following pie charts carefully and answer the questions given below. The pie chart (I) shows the percentage distribution of the total number of tickets sold by five different cinema halls on Sunday. The pie chart (II) shows the percentage distribution of the profit earned by these cinema halls on Sunday.

    NOTE: The average profit of each ticket sold is Rs 30.

  10. Question 10

    (COMMON INFORMATION FOR QUESTIONS 11 TO 15)

    Read the following information carefully and answer the questions given below. The information about three sellers who sold two types of rice, i.e., brown and white.

    The quantity of white rice sold by all three seller is 230 kg. The quantity of brown rice sold by B is 20% more than the quantity of white rice sold by A. The quantity of white rice sold by B is 20 kg more than that of brown rice. The ratio of brown rice sold by A to B is 2:3. The average quantity of brown rice sold by all three sellers is 60 kg, and the total rice (white and brown) sold by C is 75 kg.

    Q.  The total quantity of white rice sold by C is how much more or less than the total quantity
    of brown rice sold by A (in Kg).
Chat with an academic counsellor on WhatsApp