
Set theory Level - 2
Q1–10 of 40Directions for Question 1: Refer to the data below and answer the questions that follow.
In the McGraw-Hill Mindworkzz Quiz held last year, participants were free to choose their respective areas from which they were asked questions. Out of 880 participants, 224 chose Mythology, 240 chose Science and 336 chose Sports, 64 chose both Sports and Science, 80 chose Mythology and Sports, 40 chose Mythology and Science and 24 chose all the three areas.
The percentage of participants who did not choose any area is:
240/880 = 27.27%. Option (d) is correct.
Directions for Question 2: Refer to the data below and answer the questions that follow.
In the McGraw-Hill Mindworkzz Quiz held last year, participants were free to choose their respective areas from which they were asked questions. Out of 880 participants, 224 chose Mythology, 240 chose Science and 336 chose Sports, 64 chose both Sports and Science, 80 chose Mythology and Sports, 40 chose Mythology and Science and 24 chose all the three areas.
Of those participating, the percentage who chose only one area is:
504/880 = 57.27%. Hence, less than 60. Option (c) is correct.
Directions for Question 3: Refer to the data below and answer the questions that follow.
In the McGraw-Hill Mindworkzz Quiz held last year, participants were free to choose their respective areas from which they were asked questions. Out of 880 participants, 224 chose Mythology, 240 chose Science and 336 chose Sports, 64 chose both Sports and Science, 80 chose Mythology and Sports, 40 chose Mythology and Science and 24 chose all the three areas.
Number of participants who chose at least two areas is:
40 + 16 + 56 + 24 = 136. Option (c) is correct.
Directions for Question 4: Refer to the data below and answer the questions that follow.
In the McGraw-Hill Mindworkzz Quiz held last year, participants were free to choose their respective areas from which they were asked questions. Out of 880 participants, 224 chose Mythology, 240 chose Science and 336 chose Sports, 64 chose both Sports and Science, 80 chose Mythology and Sports, 40 chose Mythology and Science and 24 chose all the three areas.
Which of the following areas shows a ratio of 1:8?
Option a gives us 16:128 = 1:8. Option (a) is hence correct.
Directions for Question 5: Refer to the data below and answer the questions that follow.
In the McGraw-Hill Mindworkzz Quiz held last year, participants were free to choose their respective areas from which they were asked questions. Out of 880 participants, 224 chose Mythology, 240 chose Science and 336 chose Sports, 64 chose both Sports and Science, 80 chose Mythology and Sports, 40 chose Mythology and Science and 24 chose all the three areas.
The ratio of students choosing Sports & Science but not Mythology to Science but not Mythology & Sports is:
40:160 → 1:4. Option (b) is correct.
Directions: Refer to the data below and answer the questions that follow.
The table gives the distribution of students according to professional courses.
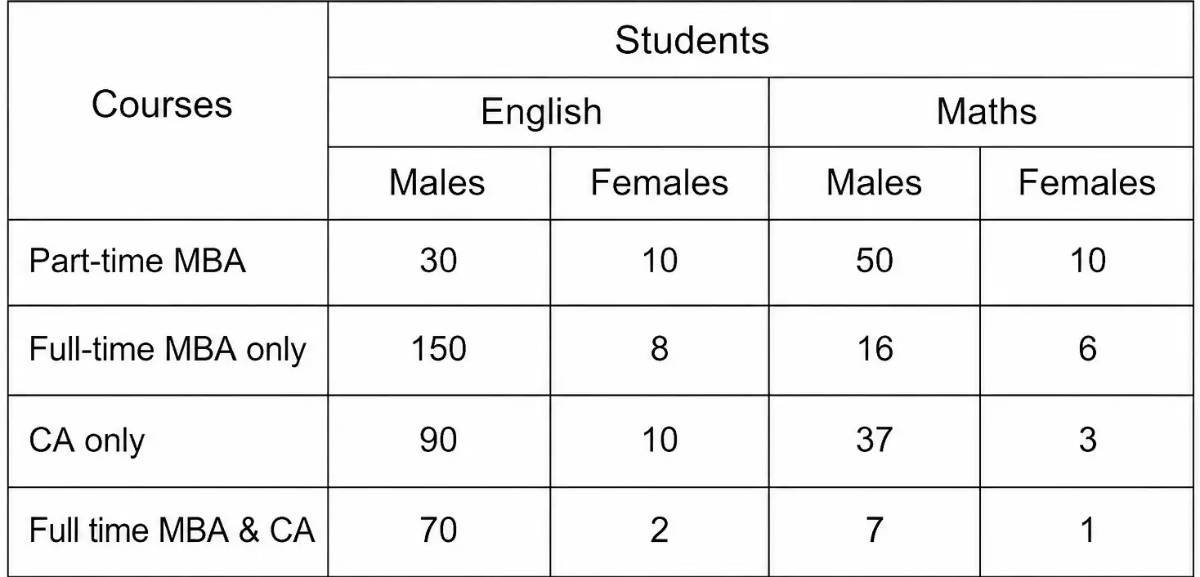
What is the percentage of Math students over English students?
The following Venn diagrams would emerge:
Full-time MBA = 150 + 70 = 220
CA = 90 + 70 = 160 (Maths)
Male
Full-time MBA = 16 + 7 = 23
CA = 37 + 7 = 44
Females
Full-time MBA = 6 + 1 = 7
CA = 3 + 1 = 4
Math Students = 130. English Students = 370
130/370 = 35.13% → Option (d) is correct.
Directions: Refer to the data below and answer the questions that follow.
The table gives the distribution of students according to professional courses.
The average number of females in all the courses is: (Count people doing Full-time MBA and CA as a separate course)
The following Venn diagrams would emerge:
Full-time MBA = 150 + 70 = 220
CA = 90 + 70 = 160 (Maths)
Male
Full-time MBA = 16 + 7 = 23
CA = 37 + 7 = 44
Females
Full-time MBA = 6 + 1 = 7
CA = 3 + 1 = 4
Number of Female Students = 10 + 8 + 10 + 2 + 10 + 6 + 3 + 1 = 50
Average number of females per course = 50/3 = 16.66 → Option
(b) is correct.
Directions: Refer to the data below and answer the questions that follow.
The table gives the distribution of students according to professional courses.
The ratio of the number of girls to the number of boys is:
The following Venn diagrams would emerge:
Full-time MBA = 150 + 70 = 220
CA = 90 + 70 = 160 (Maths)
Male
Full-time MBA = 16 + 7 = 23
CA = 37 + 7 = 44
Females
Full-time MBA = 6 + 1 = 7
CA = 3 + 1 = 4
50:450 = 1:9 → Option (b) is correct.
Directions: Refer to the data below and answer the questions that follow.
The table gives the distribution of students according to professional courses.
The percentage increase in students of Full-time MBA only over CA only is:
The following Venn diagrams would emerge:
Full-time MBA = 150 + 70 = 220
CA = 90 + 70 = 160 (Maths)
Male
Full-time MBA = 16 + 7 = 23
CA = 37 + 7 = 44
Females
Full-time MBA = 6 + 1 = 7
CA = 3 + 1 = 4
40/140 → 28.57% → Option (c) is correct.
Directions: Refer to the data below and answer the questions that follow.
The table gives the distribution of students according to professional courses.
The number of students doing Full-time MBA or CA is:
The following Venn diagrams would emerge:
Full-time MBA = 150 + 70 = 220
CA = 90 + 70 = 160 (Maths)
Male
Full-time MBA = 16 + 7 = 23
CA = 37 + 7 = 44
Females
Full-time MBA = 6 + 1 = 7
CA = 3 + 1 = 4
From the figures: 150 + 8 + 90 + 10 + 16 + 6 + 37 + 3 = 320 → Option (a) is correct.