
Line Graphs Level-1
Q1–10 of 68Directions Study the following line graph carefully and answer the questions given below.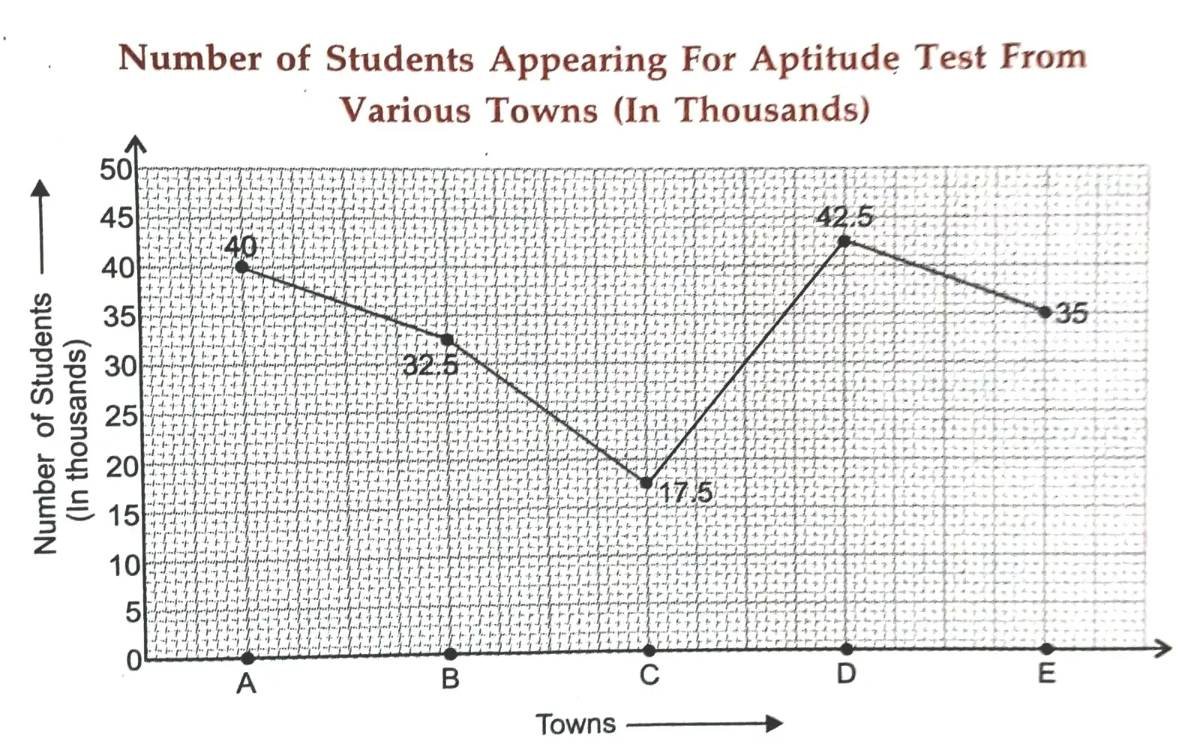
What is the ratio of the number of students appearing for the Aptitude Test from Town B to that from Town A?
Ratio of number of students from Town B to that from Town A
$$= \frac{32.5 \times 1000}{40 \times 1000} = \frac{325}{400} = \frac{13}{16} = 13:16$$
Directions Study the following line graph carefully and answer the questions given below.
What is the average number of students appearing for the Aptitude Test from all the towns together?
Average number of students appearing in Aptitude Test from all towns
$$= \frac{(40 + 32.5 + 17.5 + 42.5 + 35) \times 1000}{5} = \frac{167.5 \times 1000}{5} = 33500$$
Directions Study the following line graph carefully and answer the questions given below.
The number of students appearing for the Aptitude Test from Town E is approximately what per cent of the total number of students appearing for the Aptitude Test from all the towns together?
Required %
$$= \left\{\frac{35 \times 1000}{167.5 \times 1000}\right\} \times 100\% = \frac{350 \times 100}{1675}\% = \frac{1400}{67}\%$$
$$= 20.89\% \approx 21\% \text{ (nearly)}$$
Directions Study the following line graph carefully and answer the questions given below.
What is the ratio of the number of students appearing for the Aptitude Test from Towns C and D together to the number of students appearing for the Aptitude Test from Towns A, D and E together?
(Students from Towns C and D) : (Students from Towns A, D and E)
$$= \frac{(17.5 + 42.5) \times 1000}{(40 + 42.5 + 35) \times 1000} = \frac{60}{117.5} = \frac{600}{1175} = \frac{24}{47} = 24:47$$
Directions Study the following line graph carefully and answer the questions given below.
The number of students appearing for the Aptitude Test from Town D is approximately what percentage of the number of students appearing for the Aptitude Test from Town C?
Required percentage
$$= \left[\frac{42.5 \times 1000}{17.5 \times 1000}\right] \times 100\% = \frac{425}{175} \times 100\% = \frac{1700}{7}\% = 242.85\% \approx 243\% \text{ (nearly)}$$
**Q6.** Percentage increase in production of A from 2009 to 2010
$$= \left[\frac{700-550}{550}\right] \times 100\% = \frac{150}{550} \times 100\% = \frac{300}{11}\% = 27.2\% \approx 27\% \text{ (approx.)}$$
Directions Study the following graph and answer the questions that follow.
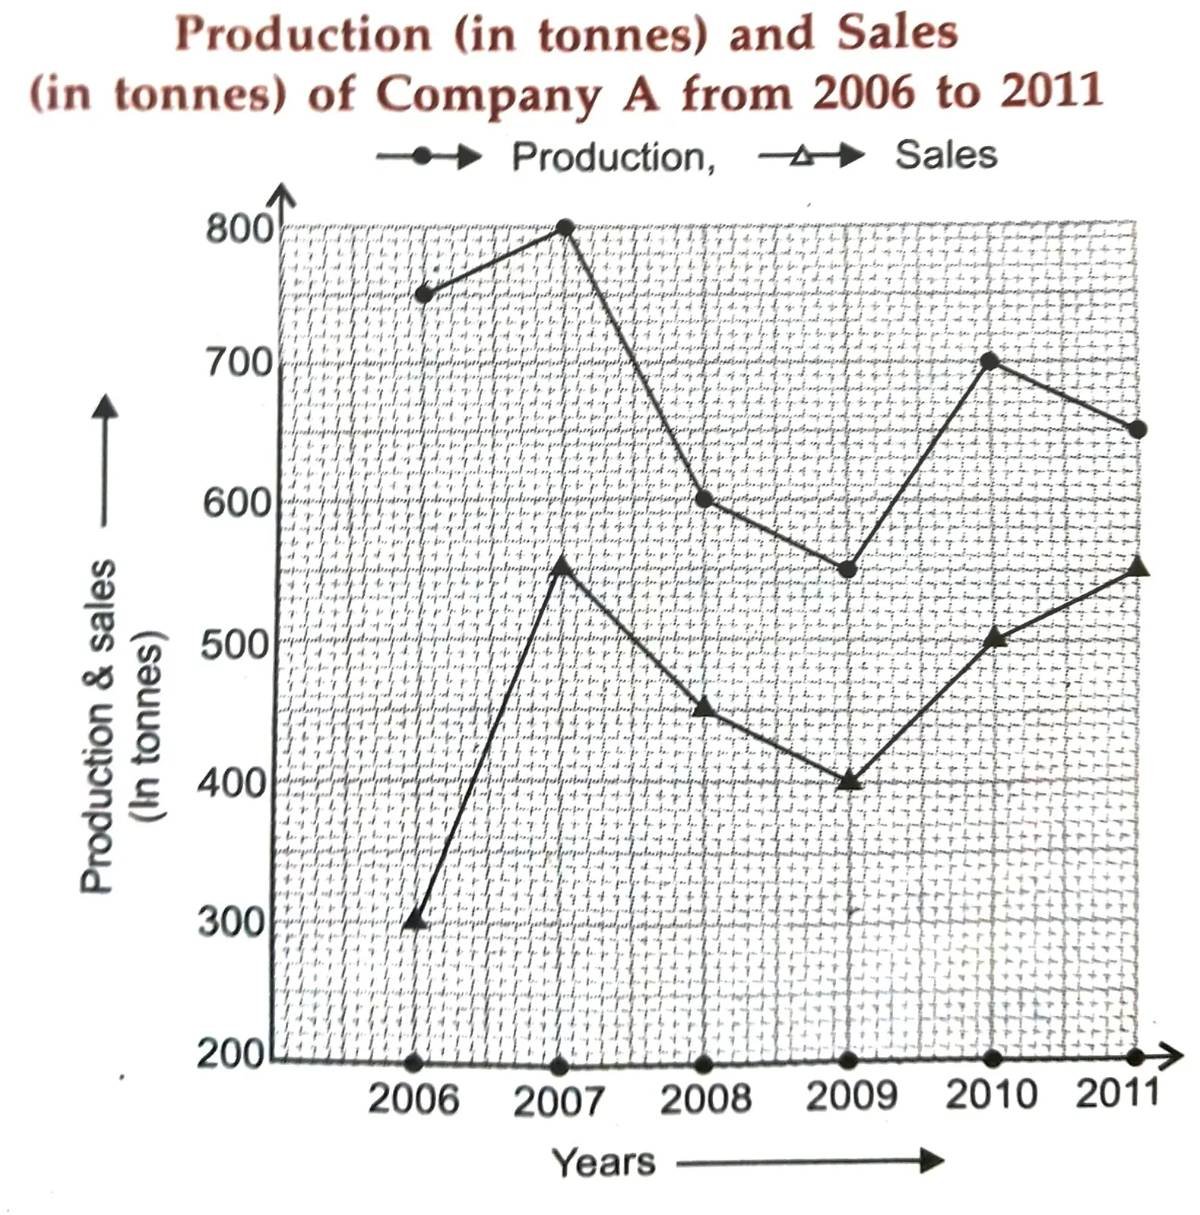
What is the approximate percentage increase in the production of Company A from 2009 to 2010?
Percentage increase in production of A from 2009 to 2010
$$= \left[\frac{700-550}{550}\right] \times 100\% = \frac{150}{550} \times 100\% = \frac{300}{11}\% = 27.2\% \approx 27\% \text{ (approx.)}$$
Directions Study the following graph and answer the questions that follow.
The sales of Company A in the year 2009 was approximately what percent of its production in the same year?
Required %
$$= \frac{400}{550} \times 100\% = \frac{800}{11}\% = 72.7\% \approx 73\% \text{ (approx.)}$$
Directions Study the following graph and answer the questions that follow.
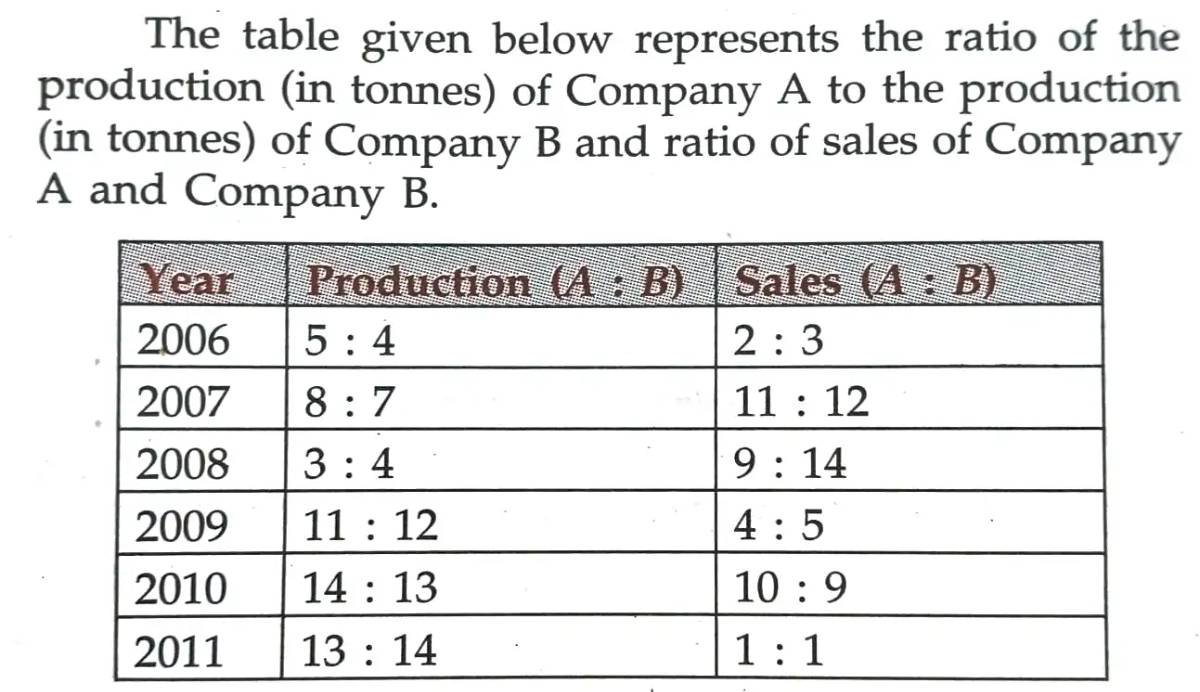
What is the average production of Company B (in tonnes) from the year 2006 to the year 2011?
Average production of Company B from 2006 to 2011
$$= \frac{1}{6} \times \left[\left(\frac{4}{5} \times 750\right) + \left(\frac{7}{8} \times 800\right) + \left(\frac{4}{3} \times 600\right) + \left(\frac{12}{11} \times 550\right) + \left(\frac{13}{14} \times 700\right) + \left(\frac{14}{13} \times 650\right)\right] \text{ tonnes}$$
$$= \frac{1}{6}(600+700+800+600+650+700) \text{ tonnes} = \frac{4050}{6} \text{ tonnes} = 675 \text{ tonnes}$$
Directions Study the following graph and answer the questions that follow.
What is the ratio of the total production of Company A to the total sales of Company A?
Total production of Company A
$$= (750+800+600+550+700+650) \text{ tonnes} = 4050 \text{ tonnes}$$
Total sales of Company A
$$= (300+550+450+400+500+550) \text{ tonnes} = 2750 \text{ tonnes}$$
$$\text{Required ratio} = 4050:2750 = \frac{81}{55} = 81:55$$
Directions Study the following graph and answer the questions that follow.
What is the ratio of production of Company B in the year 2006 to production of Company B in the year 2008?
Production of Company B in 2006 $= \left(\frac{4}{5} \text{ of } 750\right)$ tonnes $= 600$ tonnes
Production of Company B in 2008 $= \left(\frac{4}{3} \text{ of } 600\right)$ tonnes $= 800$ tonnes
$$\text{Required ratio} = 600:800 = 3:4$$